


More news on this day
Newly analyzed federal on-time performance data shows a sharp divide among U.S. airports, with a handful of major hubs and sunbelt gateways emerging as persistent hotspots for late departures in the most recent travel seasons.
Get the latest news straight to your inbox!
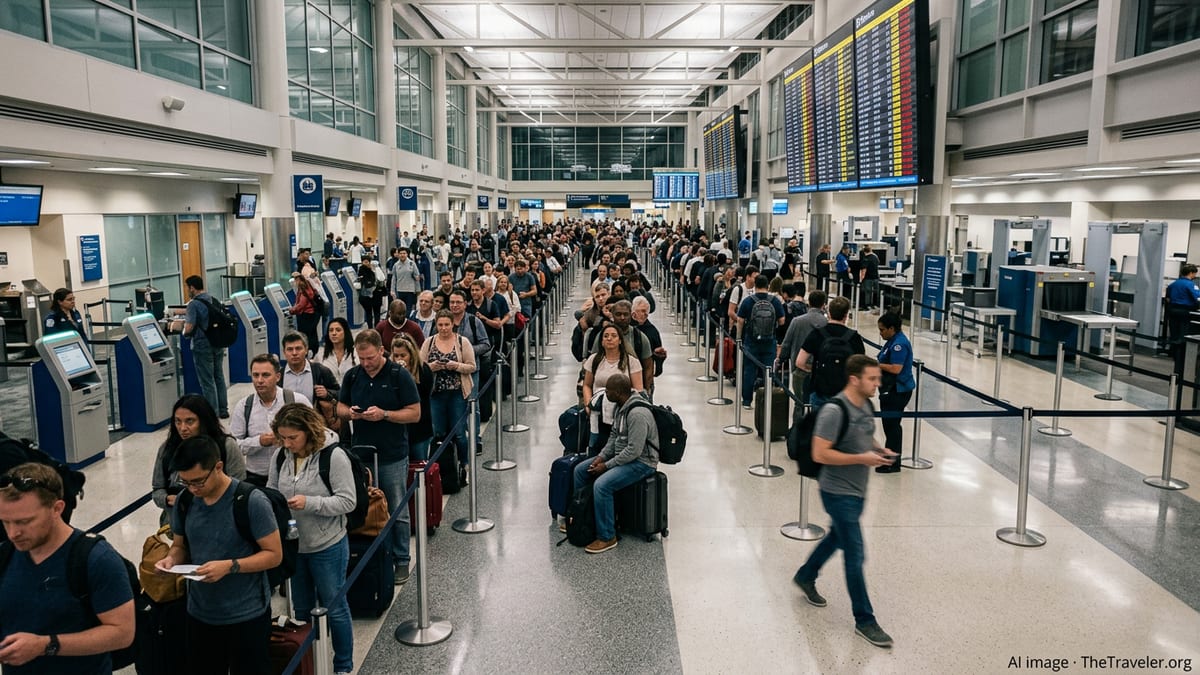
Fresh Federal Data Puts Departure Delays in Focus
Publicly available records from the U.S. Department of Transportation’s Bureau of Transportation Statistics (BTS) now allow a clear view of how reliably flights leave on time at individual airports. Using the federal definition, a flight is considered delayed if it departs 15 minutes or more after its scheduled gate time, a standard that underpins both the government’s Air Travel Consumer Reports and third party analyses built on the same database.
Across the national system, recent BTS summaries indicate that roughly one quarter to one third of scheduled departures have been running late in peak months, with summer volumes amplifying pressure on already busy hubs. Industry research on the July 2024 peak, for example, found that about 27 percent of flights from U.S. airports were delayed or canceled on departure, underscoring how disruption has become a routine risk for travelers.
While no large airport is immune to weather, congestion, or airline scheduling issues, the latest rankings derived from BTS data show that some fields see consistently worse departure performance than others. Several of the poorest performers serve large metropolitan or high leisure demand regions, where tight schedules intersect with heavy thunderstorm seasons, air traffic control constraints, or complex runway layouts.
Independent dashboards that aggregate BTS filings over multi year windows now rate U.S. airports on a composite reliability score, combining on time rates, cancellation levels, and the severity of delays. In those rankings for departures through mid 2026, the lowest scoring airports cluster in the Northeast corridor, Florida, and parts of Texas and the mid South.
Major Hubs Among the Worst for Late Departures
Government data and recent analytical summaries point to several large hubs as particularly challenging for on time departures. In many cases, the issue is not simply how many flights leave late, but how late they become on a bad day, with 90th percentile delay figures at the worst performers stretching to an hour or more.
Analyses of July 2024 BTS records highlighted Houston George Bush Intercontinental (IAH) as one of the poorest performers that month, with only about 55 percent of departures leaving on time among airports operating at least 1,000 flights. Other big hubs, including Denver International (DEN) and various East Coast airports, also landed in the bottom tier for that peak midsummer period, reinforcing a pattern in which busy connecting centers double as delay hotspots when storms or staffing issues ripple through the network.
More recent composite reliability scoring that covers July 2023 through June 2026 similarly places a number of large hubs in the lowest band for departure dependability. These scoring systems use federal data to compare each airport against a fixed benchmark, rather than just its peers, capturing not only the proportion of delayed flights but how severe and disruptive those delays tend to be when they occur.
Chicago O’Hare (ORD) and Atlanta Hartsfield Jackson (ATL), two of the nation’s busiest hubs by passenger volume, often land in the middle of the pack in annual on time percentages but still contribute heavily to the overall number of delayed departures because of their sheer scale. Local statistics published for these airports show average departure delays measured in the tens of minutes for late flights and significant seasonal swings as winter storms and summer thunderstorms hit their respective regions.
Coastal Gateways and Vacation Airports Struggle With Congestion
Some of the worst departure delay rates show up at coastal and leisure focused airports where rapid growth in demand has outpaced operational flexibility. Publicly circulated analyses of BTS statistics for 2023 and 2024 singled out San Juan’s Luis Muñoz Marín International Airport (SJU) as having one of the highest delay percentages among U.S. airports, with nearly one third of flights arriving or departing late.
Florida and Gulf Coast gateways also rank prominently in recent delay tables. Seasonal thunderstorms, limited runway capacity, and tight turnaround schedules for domestic and Caribbean flights combine to push a higher share of departures beyond the 15 minute delay threshold, especially in late spring and summer. Travelers departing these airports during peak holiday periods often face rolling gate holds as weather systems move through the region.
On the Pacific Coast, San Francisco International Airport (SFO) has drawn particular attention. Discussions referencing BTS on time data for 2026 note that SFO has, at points, recorded on time arrival rates close to just half of scheduled flights, with departure delays similarly affected. The airport’s closely spaced parallel runways and frequent low cloud ceilings limit the number of simultaneous operations that can be conducted in instrument conditions, creating knock on effects for departure banks during busy hours.
In the Northeast, legacy constraints and dense airspace play a similar role. Although recent improvements have lifted some New York area airports off the very bottom of national rankings, multiple independent analyses still show LaGuardia (LGA) and Newark Liberty (EWR) near the lower end of the pack for on time departures over multi year spans, even when accounting for modest gains in 2025 and early 2026.
What the Numbers Say About Causes of Delays
The BTS parses delays into several categories, including weather, national airspace system issues, late arriving aircraft, and delays within the carrier’s control such as crew or maintenance problems. Recent pocket guides and summaries of 2024 data show that national airspace system factors and carrier driven delays together account for a substantial share of late departures nationwide, often exceeding pure weather as a trigger.
At the most delay prone airports, these causes often overlap. Thunderstorms or coastal fog can force ground stops or capacity reductions, after which tightly scheduled aircraft and crews are no longer in the right place at the right time. When a large hub or coastal gateway is operating near its maximum runway capacity even in good weather, any disruption can cascade into prolonged departure queues.
Comparative reports that slice federal data by airport and time of day consistently show that the risk of a late departure rises as the day progresses. One large scale analysis of more than 7 million domestic flights in 2025 using BTS on time records found that early morning departures before 7 a.m. arrived late only about one in ten times, while evening flights around 7 p.m. missed their arrival targets roughly one third of the time. Those patterns are reflected at many of the worst performing airports, where long afternoon and evening delay banks are common.
For travelers passing through the least reliable airports, this means that both airport choice and schedule timing matter. A flight leaving from a chronically congested hub in the late afternoon sits at the intersection of multiple risk factors, particularly in summer when convective storms peak and schedules are densest.
How Travelers Can Use Government Delay Data
Although the raw BTS database is technical, a growing number of public facing tools translate those records into airport rankings and reliability scores. These sites and reports rely on the same federal filings that underpin official Air Travel Consumer Reports, but organize the information by airport, route, and time period so that passengers can see how often flights at their local airport actually depart as scheduled.
Several recent consumer focused studies use BTS data to publish annual or seasonal lists of the best and worst U.S. airports for delays, often separating midsized airports from the 30 largest hubs. These compilations generally agree on a core set of poor performers, highlighting the same coastal gateways and large connectors as frequent outliers on delayed departures, even as year to year percentages shift somewhat with weather and carrier schedules.
For individual travelers, the data points toward a few practical steps. Booking the first departure of the day from a delay prone airport, allowing longer connection windows through known bottlenecks, and favoring alternate airports in the same metro area when feasible can all reduce the odds of severe disruption. In busy regions such as New York, South Florida, or the San Francisco Bay Area, government on time statistics make clear that switching to a nearby airport with a stronger performance record can noticeably improve the odds of an on time takeoff.
As federal statistics for late 2025 and 2026 continue to roll out on their regular publication schedule, the rankings of individual airports may shift, but the broad pattern is unlikely to change quickly. High volume hubs operating in congested or weather sensitive airspace remain the most persistent sources of departure delays, while a smaller group of well situated and efficiently managed airports stands out for relatively reliable on time performance.
U.S. DOT Air Travel Consumer Reports (On Time Data)
BTS On Time Performance Database (Departures)
FlyerIntel Airport Reliability Rankings (Based on BTS Data)