


More news on this day
Fresh disruption data published by the Nigeria Civil Aviation Authority (NCAA) is reviving a familiar traveler question: when flights run late or get canceled, what is actually driving the breakdowns, and what do the numbers really prove? The regulator’s latest monthly summary, along with its quarterly “executive summary” releases, offers a rare, standardized snapshot of domestic performance, but interpreting it requires understanding how disruptions are counted, what “delay” means in this context, and why a single late flight can ripple across an airline’s schedule for hours.
Get the latest news straight to your inbox!
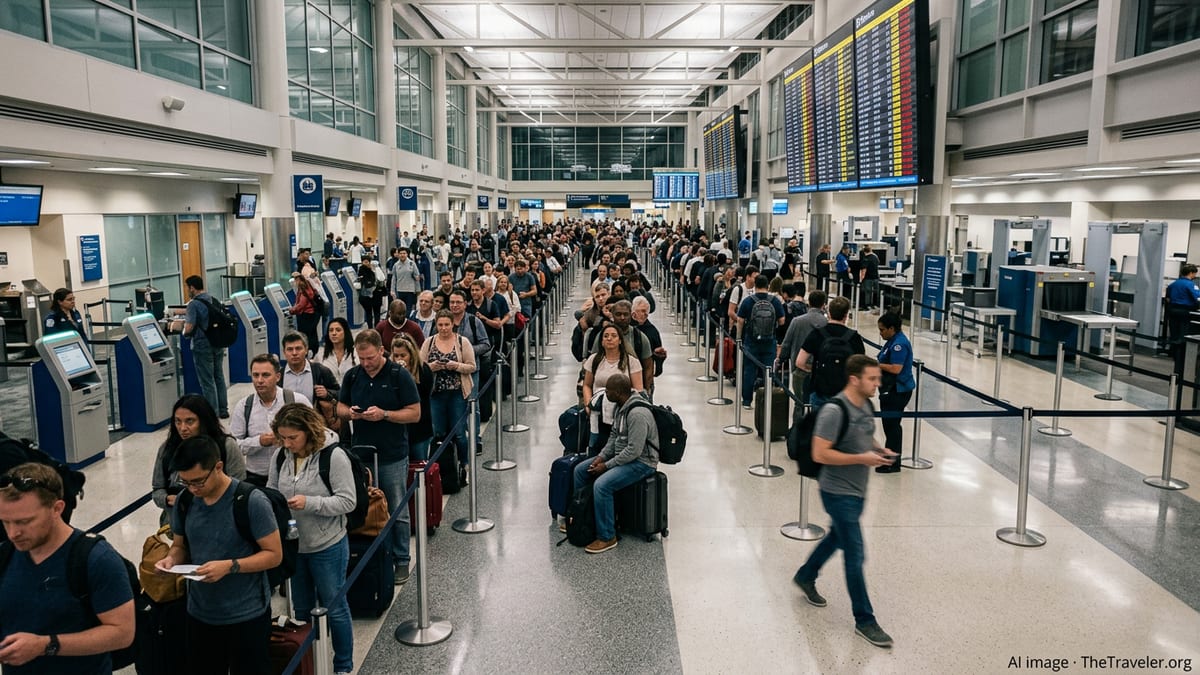
What the NCAA report says, and what “disruption” means
Published coverage and the NCAA’s own releases indicate Nigeria’s domestic airlines operated 7,961 flights in August 2026, with 4,765 recorded as delayed and 36 recorded as canceled. The disruption summary has been widely cited as showing delays affecting 59.9% of operations for the month, a headline figure that quickly shaped public discussion about reliability and passenger rights.
The report format matters. In airline performance reporting, a “delay” is a count of flights that did not operate on schedule by a defined threshold, while cancellations are flights that did not operate at all. In many international reporting systems, including U.S. Department of Transportation on-time reporting, a flight is considered “delayed” if it arrives 15 minutes or more after schedule, and cancellation definitions also follow strict rules about what counts as “not operated.” The NCAA’s summary is not a passenger complaint report; it is an operational snapshot intended to quantify what happened across carriers and routes.
The NCAA also publishes quarterly “Executive Summary of Flight Disruptions” documents, including releases covering January to March 2026 and April to June 2026. Those summaries provide a broader trend view that can help readers see whether a bad month is an outlier or part of a longer performance pattern.
Why delay rates can look shockingly high
A large percentage of delayed flights does not automatically mean most passengers experienced all-day chaos, but it does suggest schedule fragility. Even modest average delays can inflate delay counts when flight schedules are tightly timed and aircraft utilization is high, especially for airlines running multiple rotations daily with limited spare aircraft.
One widely recognized driver is “late-arriving aircraft,” a cascading effect where an inbound delay becomes the outbound delay. Operational data systems used in other markets explicitly track this category, and it often dominates delay propagation because every subsequent flight using that aircraft inherits the previous leg’s lateness unless the airline can swap equipment or build in recovery time.
Infrastructure and network constraints also amplify delay frequency. Congested peak periods, uneven slot discipline, weather disruptions, and constraints in air traffic flow management can convert small slips into widespread lateness. These are not always visible in a monthly tally, which typically reports outcomes (delayed or not) rather than a full chain of causes.
Airline-by-airline performance, and what it signals
Published reporting on the August 2026 summary indicates Air Peace operated the highest number of flights in the period and also recorded a high number of delays. Coverage of the same NCAA release also highlights United Nigeria Airlines among the carriers with notable disruption levels, underscoring that the biggest operators often dominate the raw counts simply because they fly more.
For travelers, the more informative comparison is usually a rate, not a total. A carrier operating many more flights will naturally accumulate more delays, so percentage delayed and percentage canceled tend to offer a clearer view of reliability. The NCAA’s summaries are designed to allow that kind of comparison, though readers still need to account for route mix, time-of-day schedules, and whether an airline operates mostly short hops or longer multi-sector days where knock-on effects compound.
It is also important to separate operational performance statistics from consumer-protection enforcement. The NCAA’s public communications and published coverage show the regulator uses its consumer protection framework to address passenger complaints and service failures, but disruption reporting and enforcement actions are not the same dataset. A month with high delays can coincide with passenger compensation disputes, but one does not automatically prove the other.
How to read “facts behind disruptions” without over-interpreting the data
There is a common temptation to treat a monthly delay percentage as a single, definitive scorecard of competence. In reality, delay counts usually blend multiple forces: airline planning (turnaround times, crew reserves), aircraft availability (including maintenance), airport constraints, and external factors such as weather or airspace restrictions. Without a published breakdown of primary causes, a disruption summary shows scale and frequency more reliably than it shows blame.
Even where “cause” categories exist in other countries’ reporting, they can be complicated. U.S. reporting, for example, groups delay causes into broad categories such as air carrier, national aviation system, extreme weather, late-arriving aircraft, and security. A single late departure can touch several categories, and systems typically assign one primary cause for reporting, which can oversimplify what passengers experienced on the day.
That is why the most useful takeaway from the NCAA’s disruption reporting may be trend tracking: whether reliability is improving or worsening by month and quarter, and which carriers or operational patterns consistently show higher disruption rates. Readers looking for “facts behind the disruptions” should treat the NCAA’s summaries as the starting point for accountability, not the final explanation for every delay.
What travelers can do with the report right now
For trip planning, disruption summaries are most practical when paired with real-time operational indicators. Live delay and cancellation trackers can show what is happening today by airport and airline, while monthly and quarterly regulator summaries reveal whether those “bad days” are rare spikes or a recurring feature of the network.
Travelers can also use disruption reporting as a cue to build resilience into itineraries: avoiding tight same-day connections, preferring earlier departures where possible, and planning buffers for time-sensitive events. In markets where delays are frequent, the difference between a morning flight and a late-evening flight can be the difference between a manageable delay and an overnight disruption with limited recovery options.
Finally, disruption data underscores the value of keeping documentation. When service failures trigger consumer-rights remedies, passengers typically need booking records, delay notifications, and receipts. The NCAA’s public consumer-protection framework signals that documentation is central to resolving disputes, even when a disruption is part of a broader system-wide problem.