
More news on this day
Lisbon’s city map is being quietly redrawn, as new metro links, stricter traffic rules and digital navigation tools converge to change how visitors experience Portugal’s capital on foot and by public transport.
Get the latest news straight to your inbox!
From classic paper plans to real-time navigation
For many first-time visitors, Lisbon still begins with a paper city map collected at the airport, a hotel lobby or a tourism kiosk. Those printed plans highlight the familiar districts of Baixa, Alfama, Chiado and Belém, and show the steep hills that have long defined the city’s layout. Yet the way those maps are designed increasingly reflects a city that expects travelers to rely on digital tools rather than static information.
Publicly available information from mapping services and tourism guides indicates that most visitors now cross-check printed city maps with smartphone apps, using GPS to track walking routes through the narrow streets of the historic center. This has pushed cartographers and tourism boards to emphasize landmarks, viewpoints and transport hubs more than street-by-street detail, especially for short-stay travelers who need fast orientation rather than exhaustive coverage.
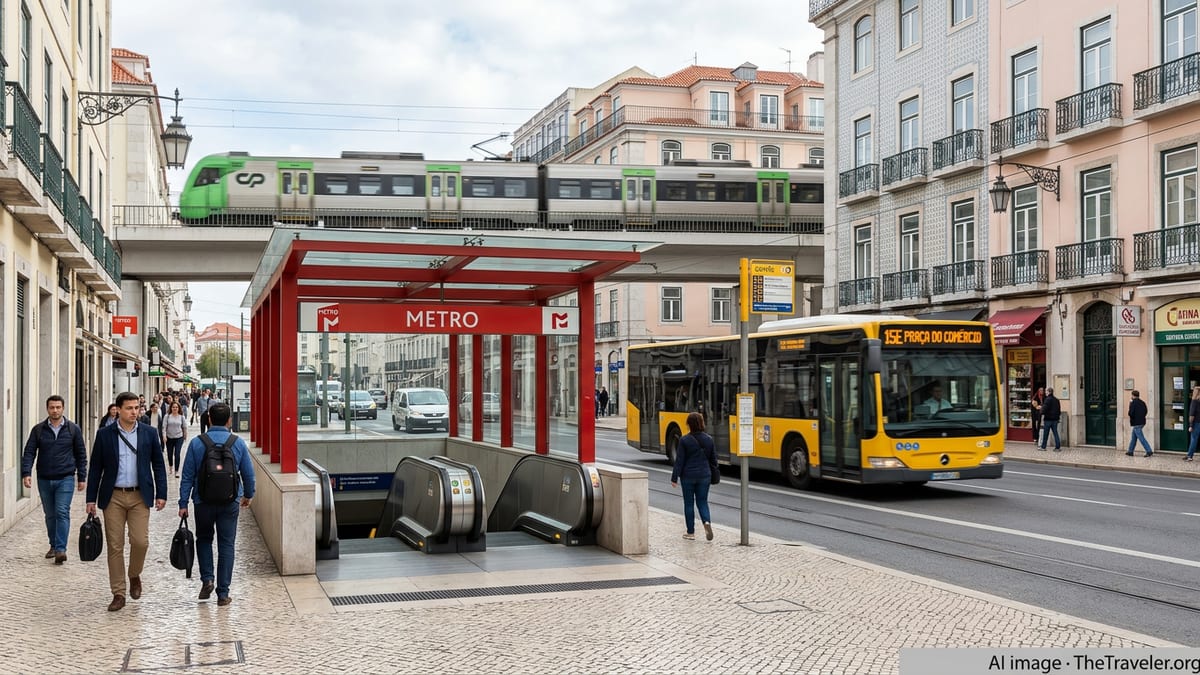
At the same time, the city’s rapid public transport system has become a central organizing feature on many contemporary maps. The four-line metro network, with 56 stations connecting the airport, downtown and peripheral neighborhoods, provides a skeleton that helps visitors understand distances and travel times more intuitively. As a result, current Lisbon city maps often place metro stations and tram corridors on equal visual footing with major monuments and squares.
Digital platforms are also incorporating layers that once appeared only in specialized printed plans, from elevation shading that highlights steep gradients to icons for viewpoints and miradouros. This is especially relevant in Lisbon, where topography affects route choices and can determine whether a ten-minute walk feels leisurely or demanding.
Metro, tram and bus routes reshaping orientation
Transport-focused maps of Lisbon have become more prominent as the metro, tram and bus networks expand and modernize. Guides to the Lisbon metro updated for 2026 show four color-coded lines that intersect with railway terminals and the airport, encouraging visitors to think of the city as a connected grid rather than a series of isolated historic pockets. The latest station and ticket information is now frequently integrated into broader city maps that combine sightseeing and mobility planning.
Tram routes, especially those of the widely used 15E and 28E services, are a defining feature on many tourist maps. Recent tram guides with embedded maps highlight the role of these lines in connecting waterfront areas, hilltop neighborhoods and traditional residential districts. Their inclusion helps travelers visualize how to link a journey through Belém’s monuments, the riverfront promenade and the hills of Graça or Estrela without relying on private vehicles.
Bus corridors and interchanges are also more visible than in previous decades. According to current tourism and transport guides, integrated ticketing now allows the same rechargeable card to be used across metro, bus, tram and some ferry services, which in turn encourages mapmakers to present these modes together. For visitors, this means that a single city map is increasingly capable of supporting multi-modal itineraries, from a metro ride to the city center to a tram climb up to a viewpoint and a bus connection to newer residential quarters.
Behind these visual changes lies a broader effort to make public transportation the default way of navigating the city. Recent updates to the metro rolling stock and plans for new tram projects are reflected on network diagrams that are often overlaid on city maps, signaling to visitors that routes will continue to evolve over the next few years.
Pedestrian zones, emission limits and new mobility priorities
Lisbon’s official mobility information shows that the road network is being progressively adapted to favor pedestrians, cyclists and public transport. Reduced Emission Zones restrict older, more polluting vehicles from circulating in central areas, while traffic-calmed “Zone 30” streets prioritize safety and slower speeds. These policies, introduced in stages since the early 2010s and refined in recent years, are beginning to influence how city maps are drawn.
On many updated plans, major through-roads are visually de-emphasized in parts of the historic center, while pedestrian streets and wider sidewalks are highlighted. The aim is to show where walking is most comfortable and where car access is limited, helping travelers select routes that match both mobility regulations and personal preferences. For visitors staying in central neighborhoods such as Baixa and Chiado, this shift in cartographic emphasis can make it easier to plan days that rely entirely on walking and transit.
Cycle network maps made available by the municipality further add to this layered picture, illustrating riverside bike paths and uphill connectors that link the waterfront to residential plateaus. Some tourism-oriented maps now fold these cycling corridors into their design, responding to growing demand for bike and scooter rentals. This creates a composite view of mobility in which a single sheet or digital layer shows where cars are restricted, where cycle lanes are marked and where tram tracks and metro stations provide alternatives.
The result is a city map that aspires to communicate policy as much as geography. Instead of simply showing streets and monuments, it increasingly signals a preference for low-emission travel, car-free exploration of historic districts and multimodal trips that minimize congestion in the most visited quarters.
New layers for sustainability and visitor services
Beyond transport, Lisbon’s city map is gaining additional layers linked to sustainability initiatives and visitor services. In late 2025, the city saw the rollout of CopoMais, a digitally enabled reuse system for beverage cups with a network of automated return points. Maps of these locations, published by the operators and referenced in local coverage, demonstrate how environmental projects are beginning to appear as distinct icons alongside traditional tourist information.
Similar mapping efforts are visible in the growing number of electric vehicle charging points, bike-share docks and micro-mobility parking areas. Although these elements are still more prominent on specialist or digital maps than on the printed plans in hotel lobbies, their presence is increasingly relevant for visitors who combine leisure travel with climate-conscious choices or who arrive in the city with shared mobility apps already installed.
Conference kits, sustainability reports and academic studies focused on Lisbon have also highlighted the expansion of pedestrian-priority streets and car-restricted zones in recent years. As this material circulates, it offers cartographers and tourism publishers a framework for incorporating not just where visitors can go, but how the city expects them to move. For example, maps used for international events now routinely show recommended walking routes between venues, metro stations and hotel clusters, rather than defaulting to road-based directions.
All of this points to a future in which Lisbon’s city map functions as a live interface between urban policy and visitor behavior. Even when printed, many maps now reference digital platforms or QR-accessible layers that can update as new projects come online, helping travelers keep pace with a fast-changing streetscape.
Historic quarters, viewpoints and day-trip connections
While mobility infrastructure and regulations are reshaping the city map, Lisbon’s enduring appeal remains rooted in its historic quarters and viewpoints. Contemporary maps typically give special prominence to the Baixa grid rebuilt after the 1755 earthquake, the tangled alleys of Alfama and Mouraria, and the terraces that line the Tagus waterfront. Symbols for miradouros such as those in Graça, São Pedro de Alcântara and Senhora do Monte help visitors orient themselves vertically as well as horizontally.
Tourism analysis indicates that these scenic points, together with the riverside promenade and the regenerated areas to the east and west, concentrate much of the city’s foot traffic. As a result, modern maps often devote extra space to these districts, sometimes compressing outlying neighborhoods to keep the most visited areas legible. Insets highlighting Belém’s monument cluster or the Parque das Nações district near the former Expo site are now standard features.
Beyond the city limits, simplified regional maps frequently show rail and road links to nearby destinations such as Sintra, Cascais and the Arrábida coast. These diagrams do not replace full transport charts, but they offer quick visual cues about journey times and directions, encouraging visitors to think of Lisbon as the hub of a wider metropolitan landscape. Railway lines to Sintra and Cascais, in particular, appear prominently in brochures and station-area maps used by tourists planning day trips.
In this evolving cartographic environment, the “Lisboa city map” is no longer a single authoritative sheet but a family of overlapping views. Together, they reflect a capital that is trying to balance heritage and modernity, encouraging travelers to explore steep streets and tiled squares while navigating a network of transit lines, pedestrian corridors and new sustainability initiatives.