


More news on this day
Delays and cancellations are once again reshaping summer air travel, as new data from regulators and aviation analysts shows airlines and airports struggling to keep flights running on time amid volatile weather, crowded skies and occasional system failures.
Get the latest news straight to your inbox!
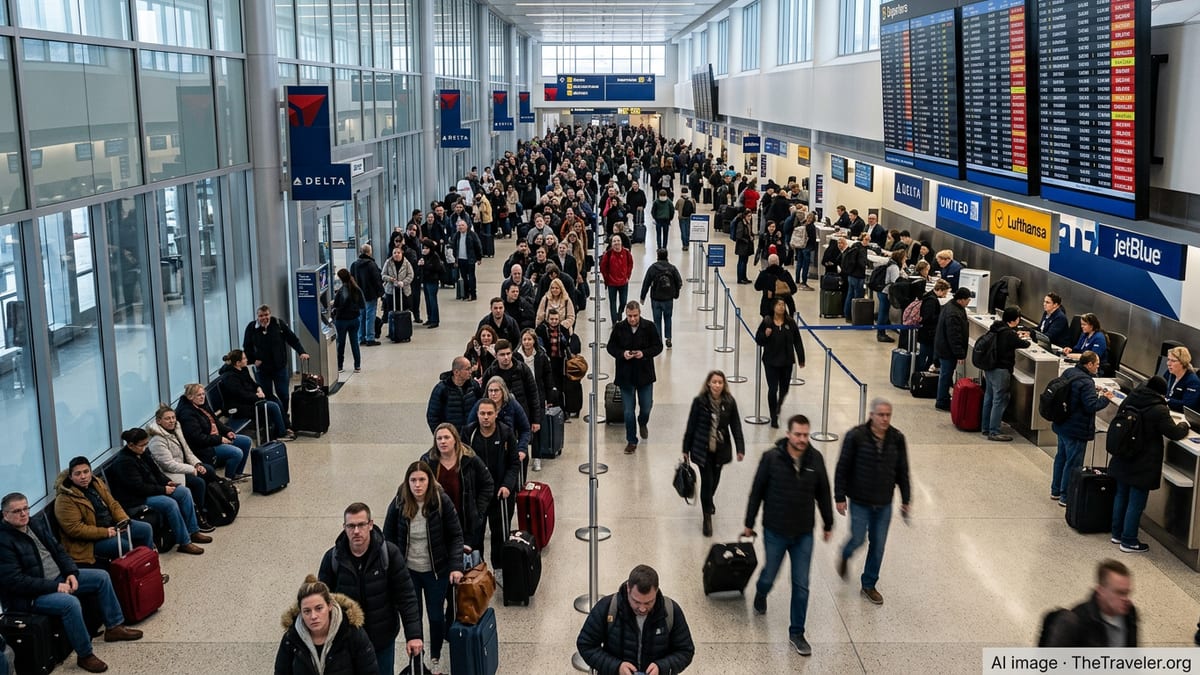
Delays rising again despite improved airline operations
Recent on-time performance figures show that, while many airlines have become more efficient, passengers are still experiencing more disruption than before the pandemic. In North America, industry analysis indicates that major carriers improved their on-time arrival rates in 2024 compared with earlier recovery years, yet the average delay per disrupted flight has grown longer, reflecting more severe knock-on effects when schedules slip.
Data from the U.S. Department of Transportation’s Air Travel Consumer Reports, which track performance by marketing carrier, show on-time arrival rates hovering in the mid-70 percent range in 2024, below pre-2019 levels, with cancellations generally in the low single digits but spiking around major disruption events and severe weather periods.
In Europe, a punctuality review by airport and air traffic management bodies found that only around two-thirds of flights in summer 2024 arrived within 15 minutes of schedule, with performance in peak months close to the worst levels recorded in two decades. Reports highlight that reactionary delays, where late-arriving aircraft and crews cascade through the network, remain a dominant factor and tend to accumulate over the course of the day.
Industry metrics from aviation data firms, which benchmark airlines globally, confirm the divergence between “average” performance and the lived experience of passengers: a relatively small percentage of flights being canceled can still strand large numbers of travelers when those cancellations cluster around busy hubs or holiday peaks.
Weather and congestion still drive the majority of delays
Publicly available figures from the U.S. Federal Aviation Administration show that in 2024 a clear majority of controllable delays in the national airspace system were attributed to weather. The agency reports that roughly six in ten delay minutes were linked to storms and other adverse conditions, with additional shares tied to overall traffic volume and runway or airport capacity constraints.
These patterns align with what passengers have experienced in recent storm seasons and during the active 2024 Atlantic hurricane season, when tropical systems repeatedly forced airlines to suspend operations at coastal hubs and re-route flights across already crowded corridors. When large swaths of airspace are restricted or airports briefly close, carriers often preemptively cancel flights in order to avoid aircraft and crews being trapped out of position for days.
In Europe, network performance reports from the region’s air navigation and airport coordination bodies describe a similar picture. Air traffic flow management measures, used to keep traffic within safe capacity limits, generated millions of minutes of delay in the summer 2024 peak, particularly in already busy control centers in southeastern Europe. Reactionary delays, weather and aerodrome capacity issues were cited as the leading causes.
For travelers, the practical impact is that even on days when skies appear clear at departure, storms or bottlenecks hundreds of miles away can force traffic managers to slow down traffic flows, imposing holding patterns, ground stops or departure slots that push departure and arrival times far beyond their scheduled windows.
Technology failures and single-point shocks expose system fragility
Alongside chronic weather and capacity pressures, a series of high-profile IT outages over the past two years has highlighted how dependent modern aviation operations are on complex digital systems. In July 2024, a faulty software update affecting a widely used cybersecurity platform triggered global IT disruptions. Published accounts show that airlines and airports across multiple continents suddenly lost access to key check-in, dispatch and crew management tools.
The incident led to thousands of delayed and canceled flights worldwide over several days, according to post-event analyses. One major U.S. carrier suffered an extended operational breakdown as crews and aircraft fell badly out of place, creating multi-day cancellations and delays even after the underlying software issue had been resolved.
European carriers and airports also reported suspensions of operations or manual fallback procedures during the same outage, with some airlines temporarily halting flight handling when digital systems became unavailable. While most operators recovered relatively quickly, the episode underscored how a single technology fault outside the airlines’ direct control can ripple quickly through global schedules.
Aviation data firms note that such shocks, while rare, can materially affect annual performance statistics for affected airlines, even when they represent only a small share of total flights. For passengers caught up in them, they often translate into lengthy waits for rebooking, widespread missed connections and significant knock-on disruption to holidays and business trips.
Staffing, infrastructure and the capacity squeeze
Several years into the post-pandemic rebound, both regulators and industry observers point to underlying structural constraints that continue to limit how many flights can operate reliably at the busiest airports and in the most crowded airspace corridors.
In the United States, analyses of air traffic staffing levels indicate persistent gaps in key facilities, particularly in the congested Northeast corridor. To maintain safety, traffic managers have at times asked airlines to trim schedules at New York–area airports and in parts of the Washington region, effectively acknowledging that demand for flights has outpaced available controller capacity.
European performance reviews highlight parallel issues on the other side of the Atlantic. Some air traffic control centers entered the 2024 summer season with traffic levels well above the continental average while still working through recruitment and training backlogs. Airports that expanded flight schedules aggressively after the pandemic, without corresponding increases in stands, gates or ground handling capacity, also reported heavier congestion at peak hours.
These underlying constraints mean that even modest disruptions can tip networks into significant delay. When gates are full or crews are operating at regulatory duty limits, a single late arrival can force subsequent flights to depart without their planned aircraft or crew, leading to cancellations that would not be necessary in a less tightly packed system.
How travelers can interpret the numbers before they fly
The latest statistics make clear that headline averages do not tell the full story of disruption risk. An airline with an annual on-time rate in the high 70 percent range may still see sharp reliability swings across particular hubs, routes or seasons. Data from government transportation databases and independent analytics firms shows that some airports, especially in storm-prone regions or with chronic congestion, experience significantly higher delay and cancellation rates than the national or regional mean.
Independent on-time rankings compiled from official filings can help passengers compare carriers and hubs over the past 12 to 24 months. Several analytics providers publish monthly and annual league tables that identify airlines with the highest completion factors and the lowest cancellation and delay rates, often broken down by region. Meanwhile, regulators offer raw on-time and cancellation data that can be sorted by route or airport to reveal consistent patterns.
For individual trips, travel planners suggest that early-morning departures, non-stop routes and flights on days with historically lighter traffic have tended to fare better in recent seasons, according to aggregated performance data. While no itinerary can eliminate disruption risk, understanding how weather, congestion, infrastructure and rare technology failures interact can help passengers set realistic expectations and make more informed choices about when and how they fly.
U.S. Department of Transportation Air Travel Consumer Reports
Federal Aviation Administration delay cause overview