


More news on this day
Summer 2026 travel may be cooling off, but the scorecards are heating up: a mix of newly released airport rankings is putting hard numbers behind what flyers felt all season, from smooth-moving regional terminals to big-name hubs plagued by delays, cancellations, and crowded corridors.
Get the latest news straight to your inbox!
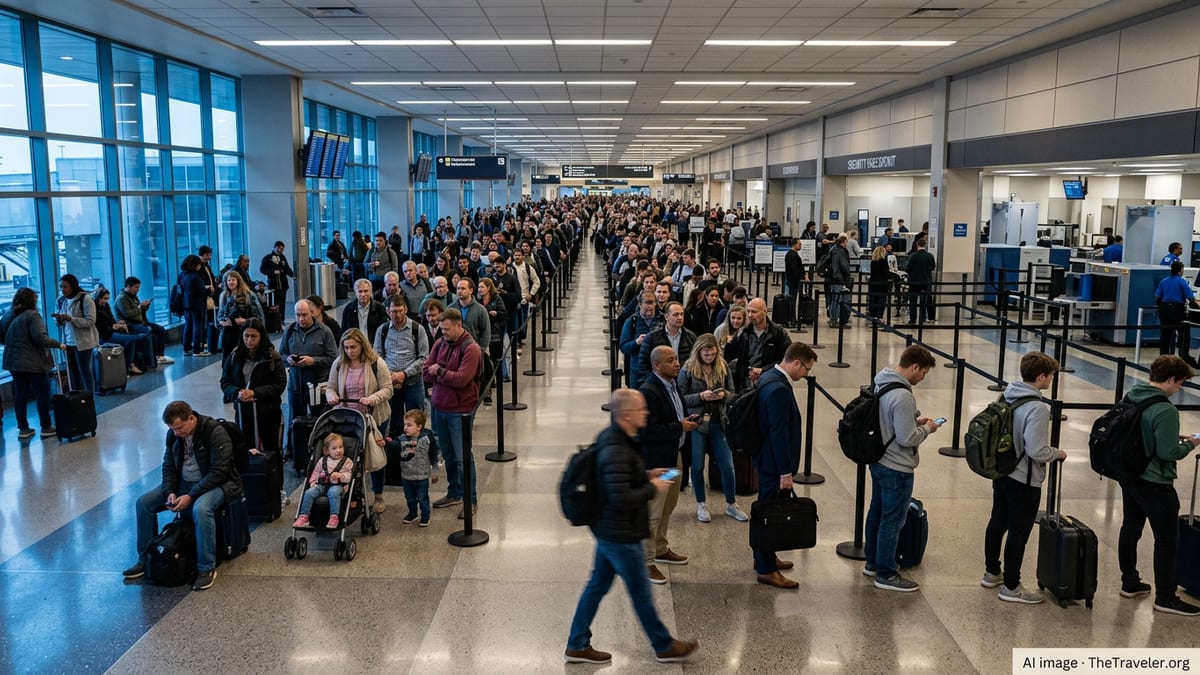
Two different “best and worst” lists are shaping the summer 2026 conversation
Published coverage this year has leaned on two distinct approaches to defining “best” and “worst.” One is passenger satisfaction, highlighted in J.D. Power’s 2026 North America Airport Satisfaction Study, which groups airports by size and scores them on a 1,000-point scale based on traveler feedback across the end-to-end airport experience.
The other is operational pain during peak season. A Forbes Advisor analysis of the 100 busiest U.S. airports looked at 12 factors tied to common travel headaches, including delays, cancellations, on-time arrivals, airfare costs, passenger growth, and infrastructure investment. In that summer-focused ranking, Newark Liberty International Airport was labeled the most frustrating airport for summer 2026 travel, with Miami International close behind.
Because the methodologies differ, some airports can look strong in one ranking and weak in another. An airport that is easy to navigate and well-liked can still be vulnerable to weather or airspace congestion, while a sprawling hub with extensive amenities can still drag down the day-to-day experience if reliability collapses at peak times.
Passenger satisfaction winners: Tampa leads large airports; Minneapolis-Saint Paul tops mega hubs
On the satisfaction side, Tampa International Airport took the top spot among large airports in J.D. Power’s 2026 North America Airport Satisfaction Study, with published coverage noting a score of 715 out of 1,000. The study is based on more than 24,000 traveler surveys from U.S. and Canadian residents who had traveled through North American airports within the prior month, according to published reporting that summarized the release.
In the mega-airport category, published coverage indicates Minneapolis-Saint Paul International Airport led the rankings again, with a reported score of 684. Mega airports are the largest, highest-volume facilities, and the category tends to be where flyers feel the tradeoffs most sharply: more nonstop options and lounges, but heavier crowding, longer walks, and more disruption risk when the operation gets strained.
J.D. Power’s framework emphasizes multiple parts of the experience, with “ease of travel through the airport” and “level of trust” among the most important dimensions highlighted in coverage summarizing the study. In practice, that tends to reward airports that have clear wayfinding, predictable security flows, and terminals designed to reduce confusion for infrequent travelers.
Operational “pain points”: Newark ranks worst for summer 2026 in a Forbes Advisor analysis
For travelers who define “best” by whether the flight actually goes on time, the Forbes Advisor summer 2026 analysis painted a stark picture of where disruptions concentrated. According to published coverage, Newark Liberty International Airport ranked as the worst airport in the U.S. for summer 2026 travel, driven by a combination of a high cancellation rate and a large share of delayed flights.
That same analysis placed Miami International Airport second, followed by Orlando International Airport, Palm Beach International Airport, and Charlotte Douglas International Airport in the bottom five. The mix is notable: it includes a major Northeast hub, multiple Florida airports that surge during summer demand, and a major connecting hub in the Carolinas.
At the opposite end of the Forbes Advisor list, Hawaii airports dominated the top, with Ellison Onizuka Kona International Airport at Keahole ranked first, followed by Lihue Airport and Kahului Airport. Published coverage also highlighted Lihue’s on-time arrival performance at more than 86% in the analysis, reinforcing a broader summer 2026 theme: smaller airports with simpler footprints can be more resilient than mega hubs when travel volumes spike.
AirHelp’s global view: strong performers in the Americas, and a long tail of underperformers
For a broader lens beyond North America, AirHelp’s 2026 AirHelp Score ranked 279 airports across 76 countries using flight data, passenger feedback, and airport comfort measures, with the scoring period spanning May 1, 2025 through April 30, 2026. In AirHelp’s global top 10, Panama City Tocumen Airport ranked No. 1 worldwide with an overall score of 8.48 out of 10, followed by Fortaleza Pinto Martins Airport at 8.42 and Cape Town Airport at 8.36.
AirHelp also breaks out “best by country” results. In the United States, AirHelp’s published country list for 2026 shows Portland International Airport as the top-ranked U.S. airport with a score of 8.09, followed by Salt Lake City International Airport at 8.04 and Las Vegas Harry Reid International Airport at 7.88.
At the other end of the AirHelp scoreboard, the company’s 2026 “worst airports” coverage highlights how far the bottom performers can fall. The lowest-ranked airport in AirHelp’s 2026 list received an overall score of 5.50 out of 10 and posted an on-time rate of 53% in the same write-up, underscoring the role punctuality plays in dragging down overall traveler experience even before amenities or terminal comfort are considered.
What travelers can take from the rankings when booking late-2026 and early-2027 trips
Across the different lists, one of the clearest throughlines is that airport size and role matter. Large and mega hubs may offer more nonstop routes and connection options, but they also concentrate disruption risk: a weather system, runway construction, or regional air-traffic constraints can cascade across dozens of gates and hundreds of daily movements.
The second lesson is that “best airport” depends on what a traveler values. Satisfaction studies tend to reward intuitive design, cleanliness, and food and retail variety, while summer “pain score” approaches tend to surface operational reliability, cancellations, and delay-prone corridors. Together, they suggest a practical strategy: when travelers have options, choosing a well-rated origin airport is only part of the equation, and connection choice can be just as important as destination.
Finally, the 2026 rankings reinforce that airport performance is not static. The biggest airports are often in continuous renovation cycles, and several summer 2026 analyses specifically flagged fast-growing airports as feeling strain under rising passenger demand. For travelers, that means checking not just the airport brand name but also the itinerary details: time of day, connection buffer, and whether the route funnels through hubs that repeatedly show up on the summer disruption lists.