


More news on this day
Labor Day weekend remains one of the most delay prone stretches on the U.S. aviation calendar, and fresh looks at federal data suggest some airports and airlines are significantly more likely than others to derail a tight itinerary.
Get the latest news straight to your inbox!
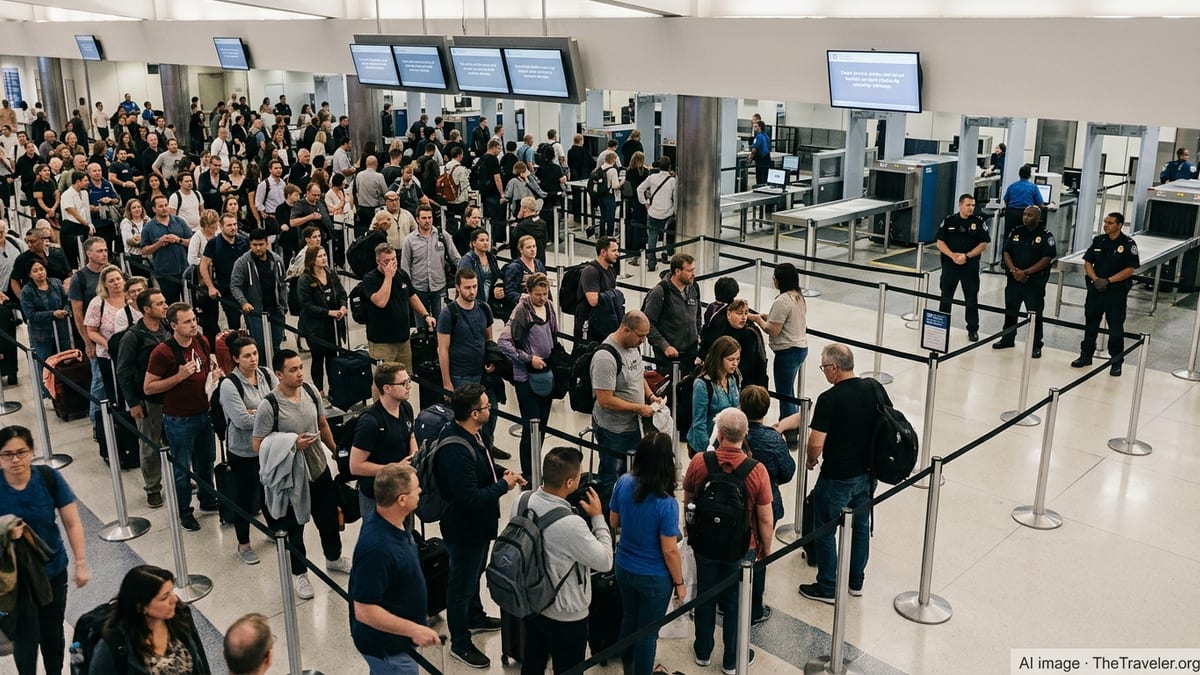
Labor Day demand collides with a fragile flight network
Transportation statistics show that U.S. airlines still cancel and delay flights at higher rates around peak holiday periods compared with calmer weeks, even as overall performance has improved from the worst of the pandemic disruptions. Federal aviation reports for 2024 indicate that roughly one in four flights arrived late in a typical month, with disruption rates climbing when weather, congestion and crew schedules all tighten at once around long weekends such as Labor Day.
Travel industry analyses built on Bureau of Transportation Statistics data describe a pattern in which Friday and Monday of the Labor Day window see the highest volume of flights and the greatest strain on runway capacity. Crowded schedules leave less room to recover from thunderstorms or air traffic control restrictions, so even small delays in the early morning can cascade into missed connections by afternoon.
The impact is uneven across the country. Federal data and independent modeling show that some airports handle the extra load with relatively modest slowdowns, while others experience sharp jumps in late departures, long tarmac waits and missed arrival targets when demand spikes. For Labor Day fliers, that means the choice of origin, connection point and airline can be as important as the decision to travel at all.
Airports where Labor Day delays are most likely
Recent modeling of Labor Day travel windows that draws on five years of federal departure records identifies a cluster of mid sized and hub airports where the odds of a disruption are notably higher than average. An analysis by The Action Network using Bureau of Transportation Statistics data for Labor Day weekends from 2021 through 2025 found that passengers departing Dallas Love Field faced an implied delay probability of more than one in three on Labor Day itself, the highest in the country in that model. Houston Hobby and several other regional airports also showed disruption probabilities above 30 percent in the same study.
Those findings align with broader airport level on time rankings compiled from official government data, which indicate that some busy hubs routinely operate with lower punctuality margins than others across the full year. Publicly available league tables of U.S. airport on time performance for the 12 months ending in 2024 show that a number of major coastal and upper Midwest airports, including San Francisco and Buffalo, recorded among the highest shares of flights delayed or canceled, making them higher risk choices for tight Labor Day connections even when weather appears calm at booking time.
Federal aviation compilations of delay causes point to a mix of factors at these airports. Congested runway layouts, frequent low clouds or coastal storms, and complex arrival and departure paths can all increase the share of flights that depart at least 15 minutes behind schedule, the standard threshold used in U.S. statistics. When those structural challenges intersect with a surge of holiday travelers moving through a limited number of gates over a compressed weekend, the likelihood that flights will push back late, sit in departure queues or be held for inbound crews tends to spike.
For travelers who must use delay prone hubs over the holiday, published advice based on that data stresses schedule padding rather than panic. Choosing longer connection times, avoiding the final departure of the night on a critical route and opting for morning flights that have not yet absorbed the day’s disruptions can reduce the risk that a single late pushback at a known bottleneck turns into an overnight stay.
Where U.S. flyers have the best odds of an on time trip
Not all airports perform poorly when the country heads to the beach or back home for the school year. The same datasets that highlight delay hot spots also show a cohort of U.S. airports with consistently strong punctuality records through 2024, including several mid sized facilities that function as important connectors without the chronic congestion of the largest hubs.
Rankings derived from Bureau of Transportation Statistics on time data show that many of these better performing airports combine relatively simple runway configurations with fewer weather disruptions. Some inland facilities, along with select Sun Belt hubs that avoid the worst winter storms and coastal fog, post on time arrival rates well above the national average, meaning that three out of four or more flights typically reach the gate within 15 minutes of schedule even in busy months.
While smaller airports can still be vulnerable to individual storms or equipment outages, the federal figures suggest that they usually recover more quickly because there are fewer flights stacked up behind each disruption. During holiday weekends, that can translate into faster turns once a thunderstorm clears and less risk of extended ground stops driven by sheer volume. Travelers who can route through these steadier performers for Labor Day, even at the cost of an extra connection, may find that the buffer is worth more than a nonstop through a chronically delayed hub.
Travel planners note that airport performance is only one part of the equation. A connection through a historically punctual field offers less benefit if the onward leg is operated by one of the least reliable carriers or scheduled late in the day when the system is already stressed. Matching a strong airport record with a relatively punctual airline and an early departure time gives Labor Day flyers their best statistical shot at an uneventful trip.
Airlines ranked from most to least punctual
Consumers comparing airlines for Labor Day trips can draw on several public summaries of on time performance that distill thousands of flights into simple rankings. The U.S. Department of Transportation’s Air Travel Consumer Report, which aggregates official carrier filings, lists year round on time arrival percentages for major airlines. For the full year 2024, those tables show Hawaiian Airlines at the top of the North American rankings, with an on time arrival rate above 87 percent, followed by Delta Air Lines and a group of other large carriers clustered in the high 70s and low 80s.
Additional compilations that repackage the same federal data into consumer friendly indexes, such as OnTimeIndex and similar trackers, broadly mirror the government order. In those rankings, Alaska Airlines, Delta and traditional network carriers tend to score toward the top for punctuality over multi year windows, while certain ultra low cost airlines occupy the lower end of the list with significantly higher shares of late arrivals and cancellations. Across all carriers reporting to the Department of Transportation, roughly three quarters of flights reached the gate on time in 2024, underscoring the gap between the most and least reliable brands.
Analysts caution that even the best performing airlines see their on time rate slip during peak holidays, when tight turn times and saturated hubs erode schedule resilience. At the lower end of the spectrum, carriers that depend heavily on a small fleet, tight banks of flights and a handful of congested bases can see a single storm, crew shortage or technology outage cascade quickly across the network. Federal complaint data compiled for early 2024 also shows that passengers flying with the least punctual airlines were more likely to seek refunds or assistance after missed connections and lengthy tarmac waits.
For Labor Day bookings, the practical takeaway from these rankings is to weigh schedule and price against the quantitative record. A short connection on a deep discount ticket operated by one of the least punctual airlines through a delay prone airport carries a much higher statistical risk of disruption than an early morning itinerary on a historically reliable carrier, even if both options show similar travel times on paper.
How Labor Day travelers can build smarter buffers
Experts who work with aviation statistics emphasize that delay and cancellation numbers are probabilities, not guarantees that a specific flight will depart late. Still, the concentration of disruptions at a handful of airports and among a subset of carriers offers concrete ways for Labor Day travelers to stack the odds in their favor.
The data driven recommendations are straightforward. When possible, choose early morning departures, which federal reports show are consistently more likely to leave on time than late evening flights. Avoid itineraries that rely on minimum legal connection times through airports that appear near the bottom of national on time rankings, especially on the Friday afternoon and Monday evening of the Labor Day window, when congestion is at its worst.
Travelers who must fly through historically delay prone airports or with lower ranked airlines can mitigate some risk by adding extra time at every step. Arriving at the airport earlier than usual allows more room to clear security and reach the gate before boarding begins, reducing the chance that a small delay at check in compounds the system wide pressures already visible in federal statistics. Building in generous layovers and considering travel a day earlier than the peak also converts what might have been a stressful race against the clock into a more manageable buffer.
Publicly available aviation dashboards, from federal Bureau of Transportation Statistics tools to independent trackers that visualize on time performance in near real time, give passengers a clearer picture than ever of how their Labor Day plans line up against past performance. Used thoughtfully, those numbers can transform a seemingly simple question of price and schedule into a more strategic decision about where and how to fly during one of the busiest weekends of the year.