


More news on this day
Travelers passing through Newark Liberty International Airport on September 5, 2026 are seeing another busy day of disruptions, with live tracking sites reporting more than 100 delayed flights and a smaller but steady stream of cancellations alongside generally moderate security wait times.
Get the latest news straight to your inbox!
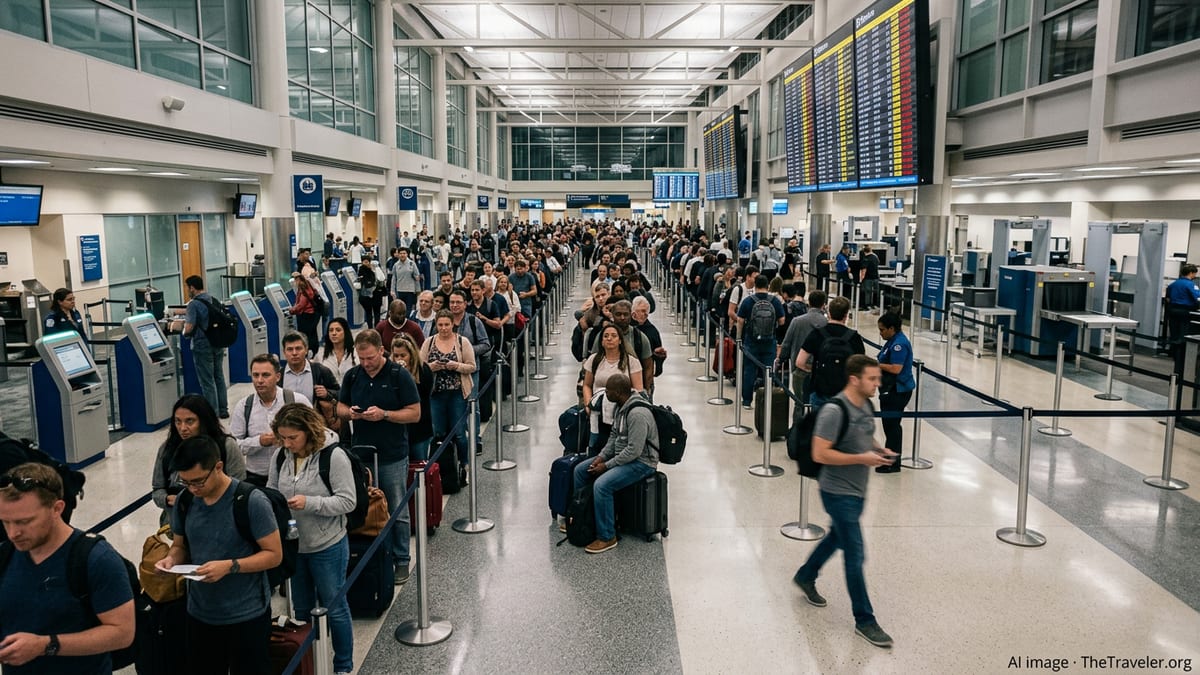
Today’s delay and cancellation picture at Newark Liberty
Live flight status dashboards show that Newark Liberty International Airport is experiencing more than 120 flight delays and several dozen cancellations over the course of the day, keeping disruption levels above what many travelers would consider typical for a major hub. One leading tracker that aggregates airline and air traffic control data lists 126 delays and a smaller number of day-of-travel cancellations attributed to a mix of late-arriving aircraft and network congestion.
These day-of numbers line up with longer-running federal statistics that describe Newark as one of the country’s more delay-prone airports. The U.S. Bureau of Transportation Statistics categorizes a flight as delayed when it arrives at least 15 minutes after schedule, and national on-time data in recent months shows roughly one quarter of U.S. flights arriving late, with just under 2 percent cancelled outright in an average month. Newark’s daily pattern today appears to be somewhat worse than that national baseline, especially during peak afternoon and evening banks.
Disruption at Newark often rises and falls with conditions in the wider New York City airspace, where traffic from three major airports must be managed in a tightly constrained corridor. Federal transportation documents describe Newark as consistently among the more delay-affected U.S. airports, in part because of the shared air-traffic environment with JFK and LaGuardia and recurring staffing shortfalls at the regional control facility. Those dynamics mean that even days with favorable local weather can see large clusters of late departures and arrivals.
While today’s cancellation totals are not at the extreme levels seen during major storms or operational meltdowns, the live numbers still translate into thousands of disrupted passengers. Afternoon and evening departures are bearing much of the brunt, as late-arriving aircraft and earlier delays cascade through airline schedules based at Newark.
How Newark’s recent performance compares with national trends
Looking beyond a single day, the most recent months of data compiled from the Bureau of Transportation Statistics indicate that Newark’s on-time arrival rate typically trails the national average. Aggregated airport-level analyses drawing on the federal on-time dataset put Newark’s recent on-time percentage in the mid-60s to mid-70s, depending on the month, compared with national performance closer to the low 70s. That gap may sound modest, but it equates to dozens of additional late flights per day at a busy hub.
Independent analysts who process the same federal records highlight that Newark has shown some improvement compared with its own historical performance, with on-time rates ticking up in recent quarters. One data dashboard built entirely from the public BTS feed shows Newark’s rolling on-time rate around three quarters of flights, and notes that the share of severely delayed departures has eased slightly versus prior years. Nonetheless, federal and private analyses alike continue to rank Newark in the less punctual tier of large U.S. airports.
Federal reports also point to specific city pairs and departure times from Newark that have been particularly delay-prone, sometimes with well over 80 percent of flights arriving late on certain routes during busy evening hours. That pattern underlines the importance of not only looking at airport-wide averages but also considering route and schedule when assessing the risk of delays.
Nationally, the latest available BTS on-time summary tables for June 2026 list about 73 percent of flights arriving on time, roughly 25 percent delayed and 1 to 2 percent cancelled. Newark’s current-day mix of more than 100 delays and elevated cancellations is broadly consistent with an airport operating on the more congested side of that national picture.
Security wait times and what travelers are reporting
Unlike flight statistics, which benefit from comprehensive federal reporting, Newark’s security wait times have become harder to track in real time. Earlier this year, the airport paused public display of checkpoint waits, citing the rapid variability of queues and staffing levels. That change has pushed many travelers toward third-party tools and crowd-sourced reports when trying to gauge how early they should arrive.
One live wait-time tracking site that monitors security checkpoints across the country currently lists Newark’s average security wait at around 5 minutes, with peaks rising higher during morning and late-afternoon rushes. Trip-planning features from other travel platforms have previously pegged typical Newark security waits closer to 20 minutes on an average day, roughly in line with other large East Coast hubs, though such estimates can swing widely depending on the terminal and time of day.
Recent user reports on travel forums describe a wide range of experiences at Newark’s checkpoints, from virtually no wait in the middle of the day to queues of 30 to 40 minutes in the early morning and evening. Several travelers note that Terminal C, which handles a large concentration of United flights, can be notably busier than the newer Terminal A at peak times, even when airport-wide averages appear moderate.
Given the limited official wait-time publishing and the variability shown in crowdsourced accounts, many frequent flyers continue to use the familiar guideline of arriving about two hours before domestic departures and three hours before international flights at Newark, with extra padding during holidays, Monday mornings or Sunday evenings.
Why Newark sees persistent delay pressure
Publicly available federal and industry documents point to a combination of structural and operational factors behind Newark’s elevated delay and cancellation profile. The airport operates as a major hub in one of the country’s densest air corridors, sharing constrained airspace with other large New York–area airports. The Federal Aviation Administration has described Newark as consistently among the most delay-impacted airports, with staffing challenges at key air-traffic facilities exacerbating congestion during peak periods.
Construction and runway or taxiway maintenance have also added complexity in recent seasons, leading regulators to grant temporary scheduling relief to airlines at Newark and several other large hubs. These measures effectively cap the number of operations, but schedules remain tight enough that weather disruptions or equipment issues at a few key times of day can ripple through the system.
Seasonal weather is another major variable. Summer thunderstorms, winter storms and low-visibility conditions can force ground stops or extended arrival spacing across the New York region, leading airlines to preemptively cancel flights or hold aircraft at gates. Because Newark functions as a significant connecting hub for both domestic and international networks, irregular operations quickly translate into missed connections and aircraft being out of position.
Despite these challenges, federal data shows modest gains in Newark’s performance over the longer term as airlines adjust schedules, regulators fine-tune slot usage and infrastructure projects progress. Observers caution, however, that the underlying airspace constraints and demand patterns mean the airport is likely to remain vulnerable to spikes in delay and cancellation numbers on busy or weather-affected days like today.
How travelers can interpret the numbers
For passengers, the growing array of dashboards and statistics can be difficult to interpret in a practical way. National on-time percentages, monthly cancellation rates and live daily tallies all describe different slices of the same picture. Today’s count of more than 100 delayed flights and elevated cancellations at Newark signals that the airport is operating under some strain, but it does not mean every flight will be significantly late.
Travel experts often recommend focusing on patterns rather than any single day’s figures. Newark’s reputation as a delay-prone hub is supported by multi-year federal statistics and recent airport-level analyses, which collectively suggest that travelers passing through EWR face a higher-than-average risk of delays compared with many other U.S. airports. At the same time, the data also shows substantial variability by time of day, route and season.
When it comes to wait times, the lack of consistent public reporting at Newark places more weight on personal planning. Security screening appears to range from a few minutes to upward of 40 minutes based on recent third-party tracking and traveler accounts, so building in extra time remains a prudent strategy, especially during busy travel periods.
Monitoring airline apps, third-party flight tracking sites and independent security-wait tools in the hours before heading to the airport can help travelers put Newark’s headline delay and cancellation figures into context. While the underlying structural pressures are unlikely to disappear soon, up-to-date information and conservative timing can reduce the risk that an already challenging day at the airport turns into a missed flight.
Live Newark EWR flight delay and cancellation statistics
U.S. DOT Bureau of Transportation Statistics on-time performance data