


More news on this day
Fresh federal data and newly compiled on-time rankings highlight a short list of US airports where flight delays are most concentrated, with busy hubs in Las Vegas, San Francisco and the New York and Washington regions emerging as particular trouble spots for travelers planning trips in late 2024 and into 2025.
Get the latest news straight to your inbox!
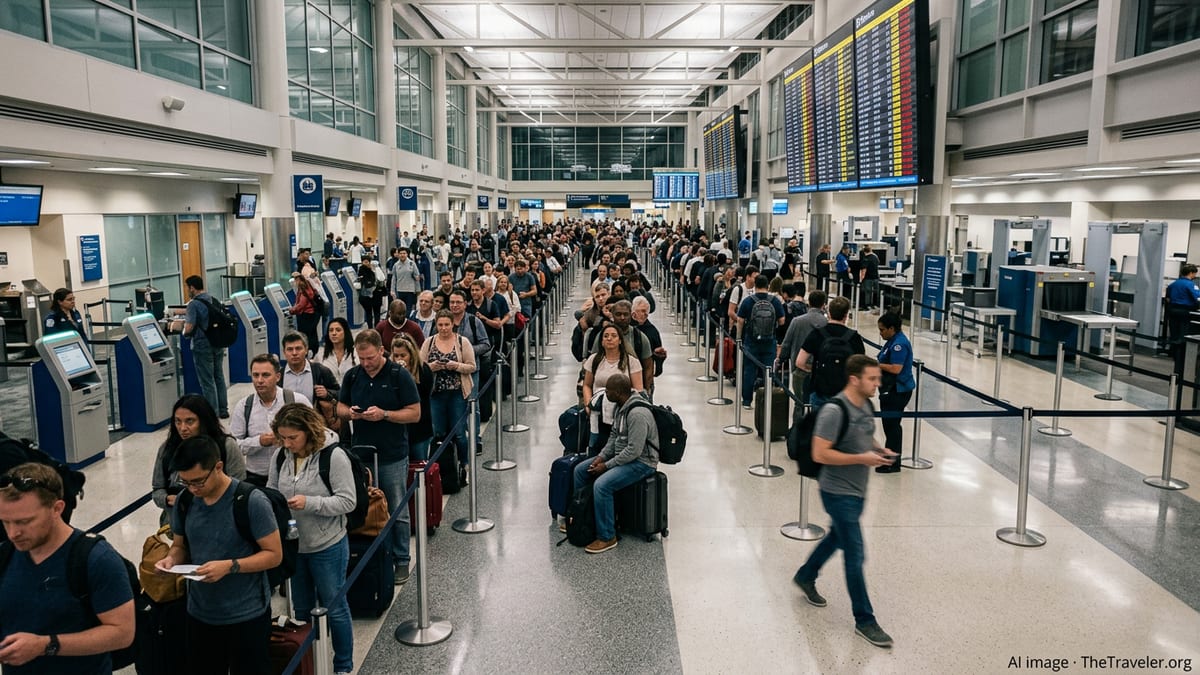
Las Vegas and San Francisco top the latest delay league tables
Recent figures from the Federal Aviation Administration’s "Air Traffic by the Numbers" update for fiscal year 2024 indicate that Las Vegas Harry Reid International Airport (LAS) and San Francisco International Airport (SFO) each recorded more than 23,000 departure delays of at least 15 minutes, the highest totals among the country’s 30 busiest airports. The FAA report notes that overall core-airport departure delays rose by 13 percent to more than 173,000 events, underscoring how congestion has intensified at a small set of major hubs.
Operational analysts point out that Las Vegas combines high leisure demand with intense summer heat and frequent thunderstorm activity, conditions that can quickly ripple into longer queues for takeoff. San Francisco, in turn, is constrained by closely spaced runways and coastal marine weather that often requires wider spacing between arrivals and departures. The result is a pattern in which even modest disruptions can push back departure times across multiple airlines and banks of flights on peak travel days.
While these raw delay counts do not adjust for total flight volume, they underscore where travelers are statistically more likely to encounter a late pushback, particularly during busy holiday weekends and convention periods. Industry forecasters expect both airports to remain under pressure as domestic demand stays elevated and international services continue to rebuild, making schedule padding and longer connection windows increasingly common in airline timetables serving LAS and SFO.
The concentration of delays at these hubs also helps explain why carriers have been gradually retiming certain bank structures and adding more early morning departures, when airspace and runway congestion are typically lower. Publicly available schedule data for late 2024 and early 2025 show several airlines shifting Las Vegas and Bay Area departures earlier in the day on routes where repeated late-evening delays had become routine.
East Coast gateways struggle with congestion and weather
On the opposite side of the country, large coastal hubs around New York and Washington continue to feature prominently in delay statistics. Background material on aviation in the New York metropolitan area notes that John F. Kennedy International (JFK), Newark Liberty (EWR) and LaGuardia (LGA) are among the worst US airports for delays, even with federal caps on takeoffs and landings designed to limit congestion. Those slot-style restrictions still leave all three fields operating near capacity during peak hours, giving airlines and air traffic managers limited flexibility when thunderstorms or low ceilings move through the region.
Published summaries of the US Department of Transportation’s Air Travel Consumer Reports for 2023 show that on-time arrival performance deteriorates notably at these airports during the summer storm season and again in winter, when snow, freezing rain and deicing operations add further complexity. Aggregated on-time data compiled by independent analysts from the same federal database similarly flag LaGuardia as having a comparatively high share of delayed operations over the past 12 to 18 months, even as some other large hubs have improved.
The Washington area adds its own pressure points. Ronald Reagan Washington National (DCA) and Washington Dulles International (IAD) both sit in weather patterns that can be volatile, with summer convective systems often aligned directly along the Potomac corridor and over mid-Atlantic arrival and departure paths. Cirium’s most recent global on-time review placed Dulles among the better-performing large airports by departure punctuality, but the same dataset highlights how quickly performance can swing from month to month as storms, runway maintenance or traffic management initiatives alter capacity.
Together, these East Coast airports handle tens of millions of passengers per year on tightly banked schedules, so even modest delays can strand large numbers of connecting travelers. For passengers planning itineraries through New York or Washington in 2025, recent data suggest that longer connection times and early-in-the-day departures remain prudent strategies to mitigate risk.
Florida and mid-Atlantic hubs show some of the worst on-time rates
Beyond the very largest hubs, several high-growth airports in Florida and the mid-Atlantic region have attracted attention for having some of the lowest on-time departure percentages in the country. An Axios analysis of Transportation Department data for December 2023 found that Fort Lauderdale–Hollywood International Airport (FLL), Baltimore/Washington International Thurgood Marshall Airport (BWI) and Orlando International Airport (MCO) recorded the weakest on-time departure rates among US airports handling more than one million annual passengers.
That snapshot aligned with broader trend analyses using 2022 and 2023 data, which show that some of the worst on-time performers are not necessarily the very largest hubs but rather fast-growing leisure gateways that face intense peaks in demand. Analysts who track federal statistics note that heavy concentrations of low-cost carrier operations, tight aircraft utilization and strong seasonality can leave these airports more exposed when weather or airspace initiatives constrain traffic flows.
Florida’s geography also plays a role. Many routes into and out of the state funnel through busy East Coast airways that are already prone to ground stops and flow-control programs during summer storms. When traffic managers slow the rate of arrivals into congested corridors, departures from Orlando and Fort Lauderdale can stack up quickly, propagating delays far beyond the state itself.
For Baltimore/Washington, the combination of intense local demand, proximity to Washington airspace and a large share of point-to-point operations contributes to variability in on-time performance. Recent federal briefings on national cancellation and delay trends emphasize that while the overall US cancellation rate through 2024 has fallen below pre-pandemic levels, pockets of chronic departure delay persist at specific airports with these structural characteristics.
Data tools put airport delay risk in sharper focus
The growing availability of public aviation performance data is making it easier for travelers and industry observers to identify where delays are most concentrated. The Transportation Department’s Bureau of Transportation Statistics publishes monthly on-time performance tables broken down by airport, and the Air Travel Consumer Report provides additional detail on the causes of delays, from carrier-related issues and late-arriving aircraft to airspace system constraints and weather.
Several independent platforms now repackage that data into more user-friendly rankings. Sites such as OnTimeStats and PlainFlights, for example, use the same federal database to produce rolling 12-month views of on-time arrival and departure percentages for hundreds of US airports. These tools typically define an on-time flight as one that arrives within 15 minutes of schedule, in line with DOT practice, and allow users to sort airports by the share of flights delayed or by average delay minutes.
Overlaying these alternative rankings with the FAA’s count-based delay figures produces a more nuanced picture. Large hubs like Las Vegas and San Francisco stand out for the sheer number of delayed departures, while some smaller or medium hubs rise toward the top of the list when performance is measured by the percentage of flights that arrive or depart late. Analysts caution that travelers should consider both the relative and absolute numbers: a small regional airport with a high share of delays may affect fewer passengers overall than a major hub where a slightly above-average delay rate applies to tens of thousands of flights.
Looking ahead to 2025, these datasets are likely to figure more prominently in how airlines design schedules and how airports target infrastructure investments. Federal reports already highlight efforts to use new air traffic management technology and runway capacity projects at some of the most delay-prone hubs, though those changes typically take years to translate into consistently better on-time performance.
What rising passenger volumes mean for future delays
The latest federal briefings on air travel heading into the Labor Day 2024 holiday period emphasize that the United States has registered the ten busiest air travel days on record this year, even as the national flight cancellation rate has fallen to around 1.6 percent. More people are flying through the same constrained airports, which helps explain why departure delays at certain hubs remain stubbornly high despite improvements in some operational metrics.
Industry reports suggest that strong demand is likely to continue into 2025, supported by a mix of leisure trips, visiting-friends-and-relatives traffic and a gradual recovery in corporate travel. For airports already topping delay rankings, that means continued pressure on runway capacity, gate availability and airspace corridors, particularly during afternoon and evening peaks.
Travel planners note that while individual days can vary widely, the underlying structural factors at the most delay-prone airports are relatively stable: geography, weather patterns, layout and surrounding airspace complexity change slowly, if at all. As a result, the same hubs that dominate federal delay statistics in 2024 are very likely to feature prominently again in 2025, absent significant schedule shifts or capacity upgrades.
For travelers, the growing clarity around which US airports struggle most with punctuality offers a practical takeaway. By consulting on-time rankings and delay statistics when planning trips, passengers can choose routings that avoid chronic bottlenecks where possible, or at least build in extra time when itineraries must pass through the country’s most delay-prone hubs.
FAA Air Traffic by the Numbers
US DOT Air Travel Consumer Report archive
Axios analysis of best and worst US airports for delays