


More news on this day
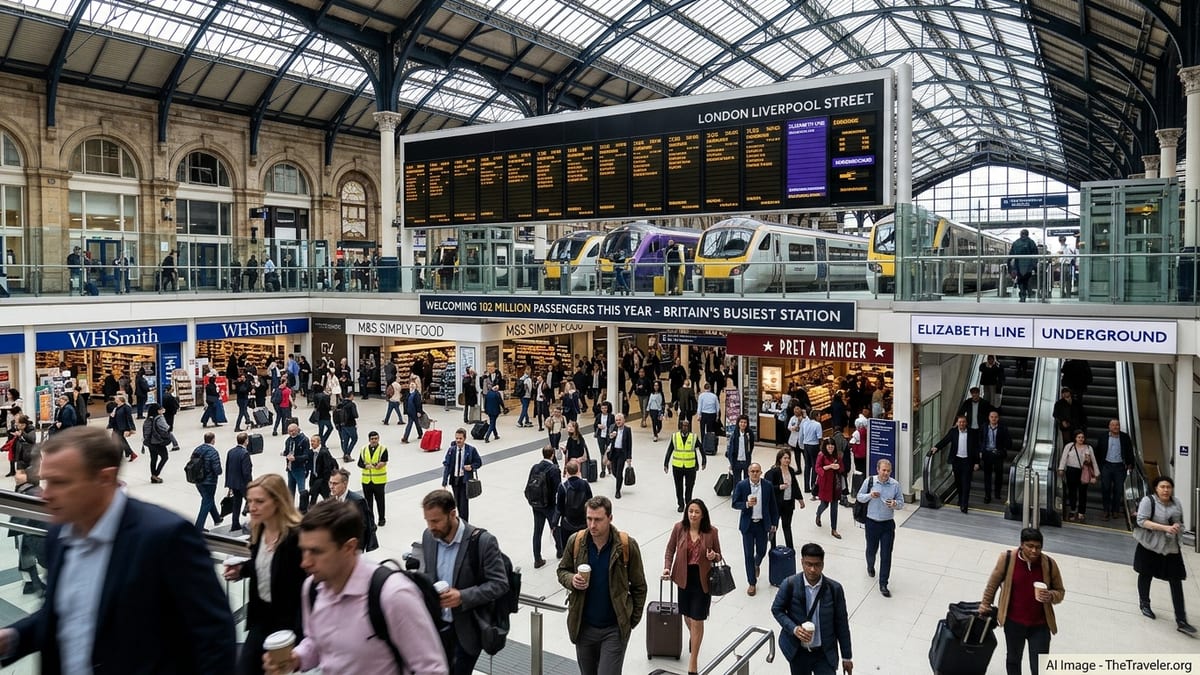
London Liverpool Street has become the first station in Great Britain to record more than 100 million entries and exits in a year, according to new official figures that also highlight an extraordinary gap between London’s busiest hubs and hundreds of lightly used rural stops.
Get the latest news straight to your inbox!
ORR data puts London hubs far ahead of the pack
The Office of Rail and Road (ORR) published its latest Estimates of station usage for April 2025 to March 2026 on 19 November 2026, confirming Liverpool Street as Britain’s most used station for the fourth consecutive year, with an estimated 102.7 million entries and exits. These statistics, based primarily on ticket sales allocated through an origin–destination matrix, are the official measure of how intensively National Rail stations are used across Great Britain.
All of the ten busiest stations in the 2025–26 tables are in London. Behind Liverpool Street, London Paddington recorded around 72.9 million entries and exits, narrowly ahead of London Waterloo on 71.6 million, followed by central Elizabeth line hubs such as Tottenham Court Road and Farringdon, and major interchanges including London Bridge, Stratford, Victoria, Bond Street and Euston. ORR notes that these volumes reflect not just long-distance and commuter demand but also intensive urban travel patterns shaped by the Elizabeth line.
Outside the capital, Birmingham New Street remained the most used station with 38.8 million entries and exits, well below the London leaders but still a key national hub. Leeds, with 28.0 million, overtook Manchester Piccadilly, on 26.6 million, to become the second busiest station outside London, while Glasgow Central, Edinburgh Waverley, Gatwick Airport and several major city terminals each handled more than 15 million entries and exits over the year.
Millions at the top, double-digits at the bottom
The same dataset underlines how unevenly rail demand is distributed. At one end of the table, Liverpool Street’s 102.7 million estimated entries and exits mean that, on average, around 281,000 entries or exits were recorded each day over the 2025–26 year, even before accounting for weekday peaks. At the other, ORR identifies Reddish South in Greater Manchester as the least used station in Great Britain, with just 94 entries and exits in the year, equivalent to fewer than two passengers a week.
Other lightly used stops include Denton in Greater Manchester on 100 entries and exits, Elton and Orston in Nottinghamshire with 102, Chapelton in Devon with 148 and Shippea Hill in Cambridgeshire with 154. These figures, which the regulator emphasises are estimates rather than counts of individual people, are based on very small numbers of recorded ticketed journeys and are sensitive to local service patterns and ticketing quirks.
Across the network, ORR’s tables list more than 2,500 National Rail stations in Great Britain. Only a relatively small group reach very high usage levels: the 2025–26 dataset shows that just over twenty stations recorded more than 20 million entries and exits, and a larger but still limited group exceeded 10 million. By contrast, hundreds of local stations handled fewer than 100,000 entries and exits, illustrating how Britain’s rail system ranges from dense metropolitan nodes to sparsely used rural halts.
Elizabeth line reshapes central London travel
For travellers, the new rankings reflect how the Elizabeth line has redrawn central London’s rail geography. Liverpool Street’s position at the top of the ORR table, together with the prominence of Paddington, Tottenham Court Road, Farringdon, Bond Street and Stratford in the top ten, highlights the intensity of flows along the cross-city corridor linking suburban termini with the West End, Canary Wharf and Heathrow.
At Liverpool Street itself, the combination of Great Eastern Main Line and commuter services, London Overground, the Elizabeth line and cross-platform connections to the Underground gives travellers a high frequency of trains to Essex, East Anglia and London suburbs, as well as fast links across the city. Similar connectivity is evident at Paddington, where Elizabeth line services now sit alongside intercity and airport trains, and at interchange stations such as Farringdon, which connects Thameslink, the Elizabeth line and the Underground.
These usage figures do not directly measure service quality, but they help explain why central London hubs typically offer short headways, long operating hours, multiple route options and a wide range of facilities. High footfall supports extensive retail and food outlets, staffed ticket offices or information points and step-free access on key routes that are designed to handle large numbers of passengers throughout the day.
Sparse services and minimal facilities at the quietest stops
At the opposite end of the rankings, the least used stations tend to be on lightly served lines, often with infrequent trains and basic infrastructure. Stations such as Reddish South, Denton or Elton and Orston typically see very few scheduled services in the current timetables, which naturally limits both local use and their role as through interchanges.
Travellers considering journeys via these quieter stations should be prepared for limited facilities, which can include unstaffed platforms, basic shelters, simple ticket machines or on-train ticket purchase, and few or no retail options. Service frequencies may be as low as a handful of trains a week on some routes, and first and last trains may not be suitable for commuting, so advance timetable checks are essential.
ORR is clear that its Estimates of station usage are a statistical picture of how stations are used, not a list of stations earmarked for closure or service cuts. The figures can inform planning discussions by train operators, infrastructure managers and local authorities, but any changes to services or facilities follow separate processes, consultations and funding decisions.
What travellers should check next
The 2025–26 Estimates of station usage are an annual snapshot and may be revised as ORR and its contractors refine their methodology or incorporate additional ticket data. The regulator advises users to consult the latest tables, quality and methodology reports and interactive dashboards when making detailed comparisons, as changes over time can reflect both real shifts in travel and technical adjustments.
For travellers planning journeys, the rankings are most useful as a guide to where services and connections tend to be most frequent or most sparse. Busy London hubs such as Liverpool Street, Paddington and Waterloo are likely to retain dense timetables and extensive facilities, while lightly used rural or peripheral stations will usually remain dependent on a small number of trains each day or week.
Before travelling, passengers should confirm live timetables, planned engineering work and accessibility information with train operators or official journey planners, especially if travelling via low-usage stations. Writers and planners using these figures should also recheck the latest ORR release before publication to ensure that they are working with the most up-to-date estimates and any subsequent revisions have been taken into account.