


More news on this day
Air travelers across the United States are facing a fresh wave of disruption as major hubs including Seattle and San Francisco report 164 flight cancellations and 2,689 delays, according to live operational data and recent aviation reports.
Get the latest news straight to your inbox!
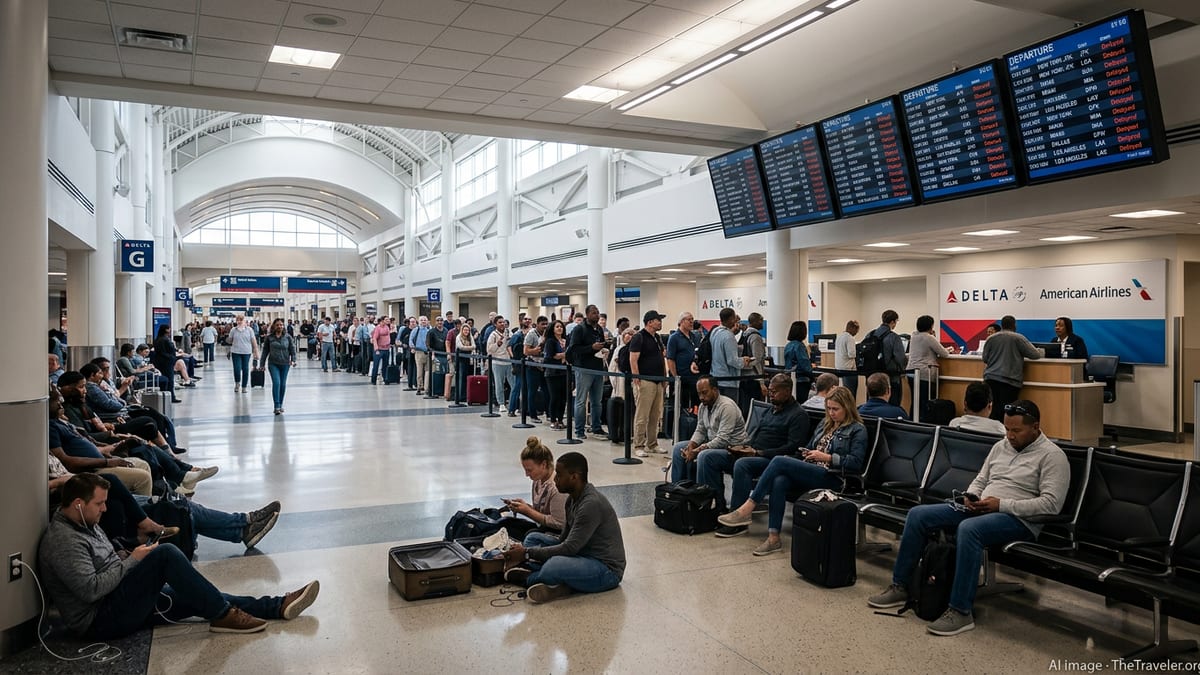
Widespread Disruptions Concentrated at Major West Coast Hubs
Live tracking platforms and recent operational summaries show that large coastal gateways such as Seattle Tacoma International Airport and San Francisco International Airport are again among the country’s most affected airports for delays and cancellations. Real time disruption maps from flight tracking providers place both SEA and SFO near the top of North American airports for the number of delayed arrivals and departures, with San Francisco reporting dozens of delayed flights and a smaller but still significant number of cancellations on the current travel day.
Airport disruption rankings compiled for today list San Francisco International with multiple canceled arrivals and a far higher volume of delayed services, while Seattle Tacoma posts one of the largest tallies of canceled flights in the United States alongside a substantial number of late arrivals. These figures align with broader national patterns seen on several recent high traffic days, when cross country and transcontinental routes funneled through West Coast hubs experienced knock on effects from weather and congestion in other regions.
Although the precise mix of cancellations and delays fluctuates throughout the day as airlines adjust schedules, the cumulative impact across the system has pushed total US disruptions into the hundreds of cancellations and several thousand delayed flights. For travelers connecting through Seattle, San Francisco and other large hubs, this means higher odds of missed connections, longer layovers and same day rebooking challenges.
Weather, Congestion and Airline Scheduling Behind the Numbers
Published data on recent travel days indicates that disruption totals of roughly 164 cancellations and more than 2,600 delays typically emerge from a combination of weather impacts, air traffic control flow programs and airline schedule adjustments. Flight tracking analyses for days with similar totals show scattered thunderstorms and low visibility at several major airports, temporary ground delays that reduce arrival rates, and airlines trimming or consolidating flights on routes where demand or aircraft availability has shifted.
At San Francisco International, historical statistics based on US Department of Transportation data highlight how airport capacity constraints and coastal weather can translate into higher delay rates than at some inland hubs. Analysis of SFO performance over the past three years shows that a meaningful share of flights experience late arrivals or departures, with cancellations concentrated on days when low ceilings, strong winds or runway works limit operations and push traffic into holding patterns.
Seattle Tacoma has faced its own set of operational pressures. Federal Aviation Administration status pages for SEA frequently show moderate gate hold and taxi delays during peak waves, even when overall conditions are categorized as normal. When low clouds or storms move through the Pacific Northwest, the airport’s role as a key connection point for transpacific and domestic services can amplify disruption across the broader network.
How Disruptions Ripple Across Routes and Airlines
The current pattern of 164 cancellations and 2,689 delays reflects how individual problem points can quickly cascade through the domestic network. On days when a hub such as San Francisco or Seattle registers double digit cancellations and dozens of late arrivals, downstream airports across the Mountain West, Midwest and East Coast often see secondary delays as aircraft and crews arrive out of position.
Route specific performance data between San Francisco and Seattle illustrates this dynamic. Analyses of this corridor over multi year periods show that while the majority of flights operate on time, it remains one of the busier and more delay prone domestic links, with weather and congestion at either end capable of disrupting multiple rotations in a single day. When paired with strong demand on transcontinental and international departures from both airports, recovery windows for airlines can be limited.
Carrier level statistics from recent nationwide disruption days reveal that large network airlines and their regional partners typically record the highest number of delayed flights, reflecting the size and complexity of their schedules. On a June 2026 disruption day that produced more than 2,600 delays and dozens of cancellations across the United States, major hubs such as Chicago O’Hare, San Francisco and Atlanta absorbed much of the impact, underscoring how tightly linked the nation’s busiest airports are when irregular operations occur.
What Today’s Numbers Mean for Passengers
For passengers, the headline totals of 164 cancellations and 2,689 delays translate into a tangible set of challenges at check in desks, security lines and boarding gates. Even when an individual flight remains scheduled, congestion created by earlier disruptions can lead to longer taxi times, limited rebooking options and competition for remaining seats on alternative departures.
Travel industry guidance based on these patterns consistently recommends that passengers build extra time into itineraries involving major hubs like Seattle and San Francisco, particularly during peak morning and evening bank periods. Booking longer connection windows, selecting earlier departures where possible and monitoring flight status closely on the day of travel are among the strategies suggested to reduce the risk of missed flights when disruption metrics spike.
Airports and airlines have expanded digital tools that allow travelers to track delays in near real time, but the scale of current disruptions shows that technology has limits when multiple weather systems, traffic management initiatives and tight schedules converge. The experience of recent high disruption days suggests that passengers who remain flexible on routing, accept same day schedule changes and travel with carry on baggage only often navigate irregular operations more smoothly.
Outlook for the Remainder of the Travel Day
With disruption counts already in the hundreds of cancellations and thousands of delayed flights, the trajectory for the rest of the day will depend on how quickly conditions normalize at key hubs. If weather systems move out of congested corridors and arrival rates recover at major airports, some of the backlog can be cleared during late afternoon and evening waves, though residual delays often persist into the night.
Real time airport status pages maintained by aviation authorities indicate that, as of the latest updates, general departure and arrival delays at Seattle and San Francisco are moderate, with some flights held at gates or in the air for short periods. However, the presence of even minor ongoing flow restrictions can limit the ability of airlines to fully recover from earlier cancellations, especially on longer haul and transoceanic routes that operate with fewer daily frequencies.
For travelers preparing to fly later in the day, publicly available tools from flight tracking sites and airport operators remain the most immediate way to assess whether the broader pattern of 164 cancellations and 2,689 delays is likely to affect a specific journey. Monitoring these platforms, confirming flight status directly with the airline and adjusting ground transportation and connections accordingly can help mitigate the practical impact of one of the more disrupted US travel days in recent weeks.
FlightAware – Live US flight delay and cancellation statistics
Flightradar24 – Airport disruption map for North America
NomadLawyer – USA flight disruption crisis report, June 26, 2026