


More news on this day
Texas drivers are spending less time stuck in traffic than they did eight years ago, even as more vehicles crowd the state’s highways, according to new congestion data released by the Texas Department of Transportation on November 19, 2026.
Get the latest news straight to your inbox!
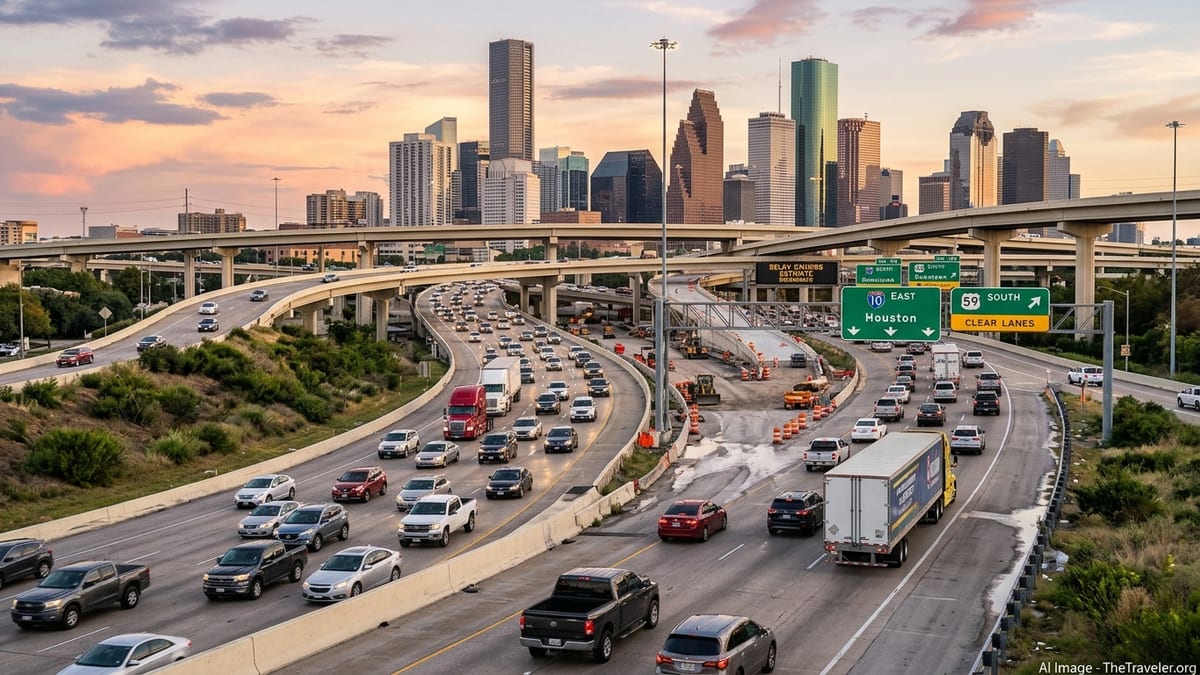
What the new congestion numbers actually show
In its story titled “Traffic delays down 11% as travel grew 13%,” TxDOT reports that statewide vehicle travel in Texas in 2025 was 13% higher than in 2017, yet total congestion delay was 11% lower over the same period. The figures come from TxDOT performance metrics and congestion analysis by the Texas A&M Transportation Institute, using data from the annual Texas Top 100 Congested Road Segments report and the agency’s Optimize System Performance dashboard.
TxDOT and TTI present 2017 as a recent congestion peak for the state, creating a before-and-after comparison that captures both rapid growth and years of road building. The 2025 numbers build on an earlier comparison using 2024 data, which found that statewide travel had risen about 12% since 2017 while delay had fallen roughly 12%. For 2024 alone, TxDOT estimated that those improvements saved commuters about $1.8 billion in time and fuel compared with 2017 conditions.
In the latest 2026 summary, TxDOT calculates that the 2017-to-2025 improvements translated into about $1.6 billion in statewide savings in 2025, or roughly $235 per commuter per year. These are aggregated estimates based on travel time and fuel that would have been lost if 2017-style congestion had persisted despite higher traffic volumes.
How Texas is cutting delay with more cars on the road
TxDOT attributes the lower delays amid higher demand primarily to targeted congestion relief projects, particularly the multibillion-dollar Texas Clear Lanes initiative and major expansions on urban freeways. Those programs have focused on some of the most heavily used corridors in metropolitan areas, where relatively small improvements in traffic flow can translate into large time and fuel savings when multiplied across hundreds of thousands of daily trips.
The Top 100 Congested Road Segments work, carried out by TTI for TxDOT each year, looks at the corridors where Texans lose the most time. Statewide delay metrics reported this week are built up from that segment-level analysis, combined with broader network data captured in the Optimize System Performance dashboard. According to TxDOT, nearly half of the road segments in the 2026 Top 100 list are already under construction, with more projects in planning or design, which means the congestion picture will continue to evolve.
While TxDOT emphasizes the role of its investments, the agency and TTI also note that changing travel patterns play a part. Remote and hybrid work arrangements, shifts in freight timing, and adjustments in when and how people choose to travel have all affected how congestion builds during peak periods. The published figures describe the combined result of these influences rather than proving that construction projects alone produced the observed delay reductions.
What this means for everyday Texas road trips
For travelers, the headline finding is that the average Texan now loses fewer hours and less fuel to congestion than at the last pre-investment peak, even though there are more people, more cars and more freight vehicles using the roads. Peak-hour trips in cities like Dallas–Fort Worth, Houston, Austin and San Antonio are still noticeably slower than free-flow conditions, but in many cases they are not as punishing as they would be if congestion had risen in step with demand.
The 2024 Top 100 analysis showed that, across all monitored segments, annual delay dropped compared with 2017 while vehicle miles traveled increased, suggesting that many upgraded corridors now carry more traffic at lower or similar levels of congestion. For individual drivers, TxDOT’s 2024 estimate of roughly $240 in annual savings per commuter, and the updated 2025 estimate of about $235, represent avoided costs rather than a bill or rebate: time that is no longer spent idling in traffic and fuel that no longer has to be purchased.
Conditions, however, are far from uniform. Some local corridors, including parts of the Houston, Dallas–Fort Worth and San Antonio networks, still appear in the top congestion rankings and in some cases have seen delay worsen at the segment level. Travelers using these routes at peak times may not feel any day-to-day improvement yet, particularly where construction is underway and temporary lane closures or detours add to backups.
Limits of the data and what travelers should watch next
The November 19 TxDOT story does not publish a full, route-by-route breakdown of 2025 congestion. Instead, it summarizes statewide trends and highlights that a large share of the Top 100 segments are in some phase of project delivery. Travelers looking for specifics about individual freeways or city corridors will need to consult the latest Texas Top 100 Congested Road Segments report and the Optimize System Performance dashboard, which provide segment rankings, delay estimates and cost impacts when they are updated.
It is also important to keep the timeframe and scope in view. The confirmed improvements cover conditions through 2025; they do not guarantee that congestion will continue to fall as Texas adds residents, jobs and freight traffic in the late 2020s. National data from the Texas A&M Transportation Institute’s Urban Mobility reports show congestion rebounding in many U.S. cities after the pandemic-era lull, and some Texas metros, including San Antonio, have already seen delays climb compared with 2020 and 2021, even if they remain below earlier peaks.
For road travelers planning trips in Texas, the practical takeaway is to treat the statewide figures as a sign that investments and changing travel behavior have, so far, kept congestion from growing in line with demand, not as evidence that traffic is “fixed.” Before major journeys, drivers may want to check TxDOT’s current construction alerts and any new Top 100 rankings for their route. The next rounds of TTI Urban Mobility and Texas congestion reports, as well as announcements of newly funded mega-projects, will indicate whether the current trend of higher travel with lower delay can hold as traffic volumes continue to rise.