


More news on this day
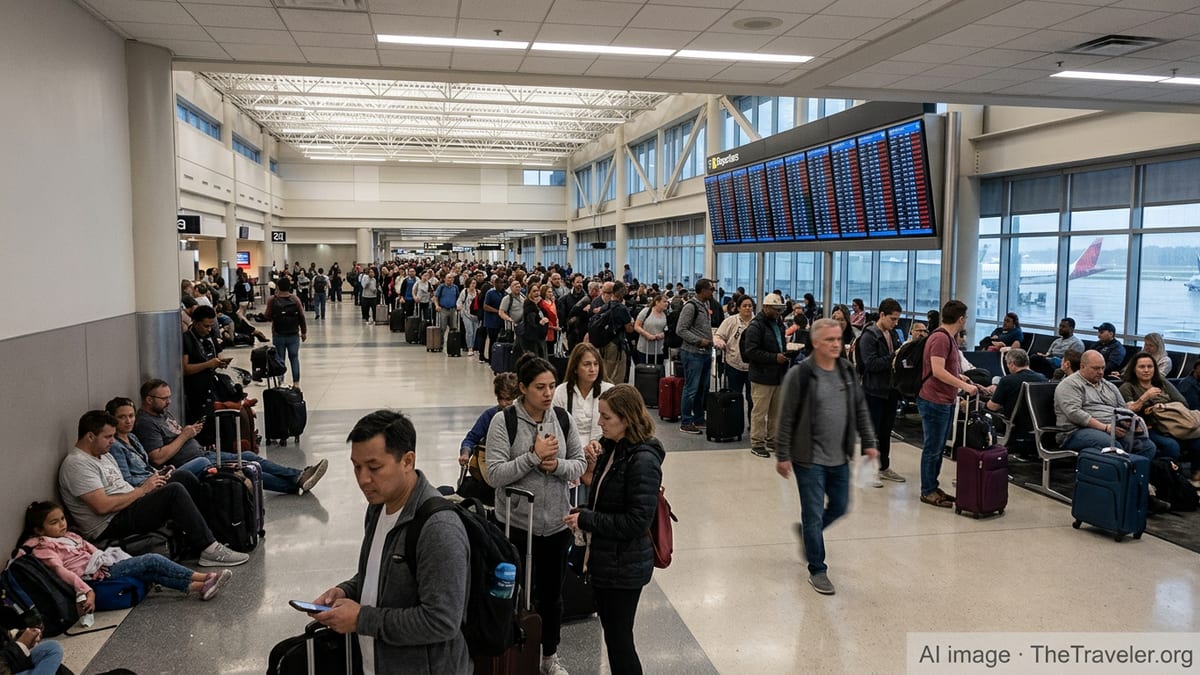
New analysis of federal on-time performance data points to 30 major US airports where departing flights are most likely to leave late, underscoring how congestion, weather and network complexity continue to shape the passenger experience in 2024 and 2025.
Get the latest news straight to your inbox!
How the ranking of delayed airports was compiled
The latest rankings draw on US Department of Transportation Bureau of Transportation Statistics data covering domestic flights from mid 2024 through mid 2026. The figures track the share of scheduled departures that left 15 minutes or more behind schedule, a standard federal definition of a delayed flight. Publicly available dashboards and third party aggregators that mirror this dataset were used to identify airports with the highest proportion of delayed departures among large and medium sized US facilities.
To keep the focus on major passenger gateways, the list is limited to commercial airports handling at least several million passengers per year. Both hub and leisure focused airports were included. The 30 facilities were then ranked by their departure delay rate, with average delay minutes used as a secondary indicator when rates were similar.
While delay statistics can fluctuate month to month, the picture that emerges across multiple reporting periods is broadly consistent. Large hubs with dense schedules and complex banked operations, along with certain weather sensitive coastal and Sun Belt airports, record more late departures than peers with simpler traffic patterns and more favorable operating conditions.
Because the underlying DOT data is public and standardized, the rankings provide a comparable snapshot across very different airports and airline networks, even though they do not capture every nuance behind an individual delay.
The 10 most delay prone major US airports
According to compiled federal data and recent independent analyses built on that dataset, San Francisco International Airport (SFO) currently tops the list among major US airports for delayed departures, with close to three in ten flights leaving late in the most recent full reporting year. Reports indicate that a combination of frequent coastal weather issues and a tightly scheduled runway system contribute to the high delay share at SFO.
Several other large hubs also appear near the top of the ranking. Chicago O Hare International Airport (ORD) and Newark Liberty International Airport (EWR) both handle heavy connecting traffic and operate in congested Northeast and Midwest airspace. Publicly available statistics show that each records departure delay rates solidly above the national average for large airports, with average late departure times stretching well past half an hour on affected flights.
Atlanta s Hartsfield Jackson International Airport (ATL), the country s busiest passenger hub, also features in the top tier once delay rates and total delayed flights are considered together. Although its percentage of on time departures often lands near or slightly below the national average, the sheer volume of traffic means ATL accounts for a significant share of all late departures nationwide, as documented in earlier systemwide delay studies.
The rest of the top ten is rounded out by major connecting or coastal gateways including Dallas Fort Worth International (DFW), Los Angeles International (LAX), Denver International (DEN), Miami International (MIA), and Boston Logan International (BOS). Each operates close to capacity during peak periods, and several contend with seasonal thunderstorms or winter weather that can ripple through departure banks.
Florida and leisure gateways stand out for late departures
One of the clearest patterns in the ranking is the concentration of Florida airports among the 30 worst performers for departure delays. Analyses of recent DOT data highlight Orlando International (MCO), Fort Lauderdale Hollywood International (FLL), Tampa International (TPA) and Miami International (MIA) as consistent laggards on on time departures among high volume US airports.
These airports tend to see intense seasonal peaks tied to holidays and school breaks, with heavy reliance on leisure oriented carriers that run tight turn times and dense schedules. Publicly available research on 2022 through 2024 performance found that several Florida gateways had some of the highest average arrival and departure delay minutes among major airports, even as overall national on time rates improved.
Outside Florida, other leisure focused gateways also place prominently in the ranking. Las Vegas Harry Reid International (LAS) and Honolulu s Daniel K. Inouye International Airport (HNL) both appear in the upper half of the 30 airport list for delayed departures. In these cases, long haul route structures, time zone differences and complex banked departure waves can amplify the impact of any disruption, leading to higher delay shares despite generally favorable local weather.
For travelers, the pattern suggests that flying from or through warm weather or vacation heavy airports does not necessarily guarantee smoother operations. On busy days, these airports can be among the most delay prone in the country, particularly in the late afternoon and evening time bands when earlier disruptions have had time to cascade.
Mid tier hubs where delays add up
Beyond the largest coastal and Sun Belt gateways, several mid tier connecting hubs also make the list of 30 major US airports with the most departure delays. Airports such as Charlotte Douglas International (CLT), Houston George Bush Intercontinental (IAH), Phoenix Sky Harbor (PHX) and Seattle Tacoma International (SEA) report departure delay rates modestly above the national large airport average in the most recent federal data.
These hubs may not top the chart on percentage terms, but their combination of steady traffic and sustained delay rates leads to substantial numbers of late flights overall. Earlier systemwide analyses have pointed out that a relatively small group of high volume hubs accounts for the majority of recorded delay minutes nationwide, even when those hubs do not always have the very worst percentages.
Some airports that historically struggled with punctuality, such as New York s LaGuardia Airport (LGA), still feature in the 30 airport ranking but have seen gradual improvements as infrastructure projects and airspace changes come online. Federal and third party statistics show that LaGuardia s on time departure share has climbed in recent reporting periods, even though it remains more delay prone than many inland peers.
By contrast, several secondary hubs in less congested regions tend to sit just outside the top 30 for departure delays, with better on time records despite growing traffic. This divergence highlights how local weather patterns, regional air traffic flow constraints and the structure of airline schedules can be as important as raw passenger volume in shaping delay performance.
What delay trends mean for travelers
For passengers, the new ranking underscores that departure delay risk is not evenly distributed across the US airport system. One out of every three domestic flights nationally left at least 15 minutes late in recent years, according to aggregated analyses of DOT records, but the odds of a late departure rise meaningfully at the airports clustered near the top of the 30 airport list.
Travelers with flexibility can use this information to adjust their plans. Independent analysts who have studied more than 7 million recent flights report that choosing earlier departure times, avoiding peak holiday periods and routing through more reliable hubs such as Salt Lake City International (SLC) can substantially improve the likelihood of an on time departure, even when the origin airport has a higher than average delay rate.
The rankings also highlight the limitations of focusing solely on airline choice when trying to avoid delays. Carrier practices do matter, but public data shows that airport level factors such as runway capacity, typical weather and regional congestion play a significant role. Even the best performing airlines experience elevated delay rates when operating heavily at some of the highest ranked delay prone airports.
Because all of the underlying on time data is updated regularly by federal transportation officials, travelers and industry watchers can expect further refinements to these rankings as more months of 2025 and 2026 operations are published. For now, the 30 airports identified offer a data backed snapshot of where US passengers are most likely to watch departure boards slip past their scheduled times.
US DOT BTS Aviation Facts and Figures
FlightRecord most delayed US airports ranking
InsureMyTrip US airport delay and cancellation statistics
Axios coverage of best and worst US airports for on time departures